Friday, July 3, 2009

Biodiversity databases and OGC standards don't play well together


Some days ago Tim and I had some discussions about how to provide OGC services for biodiversity databases, like for example the Global Registry of Migratory Species. This time the reason for the discussion to start again was the discovery of the new INSPIRE Geoportal Viewer. For those who don't know it, the INSPIRE directive is pushing the creation of a common infrastructure fo sharing geospatial data within Europe. They plan to do that by using Open Standards like the ones from the Open Geospatial Consortium (OGC).

The typical use case they always describe with these Spatial Data Infrastructures (SDIs) is having a registry of services (Catalog Service) where a user can find geospatial data. The data is available through Web services, like Web Map Server (WMS) or Web Feature Service (WFS). With a
web or desktop GIS client you discover, connect to the services, display different layers, do some analysis, print results, etc. All by using open standards and mixing data from lot of different places.

The INSPIRE registry and Geoportal Viewer is the typical example. On the viewer you can select from a list of available services (registered on the catalog service) or use your WMS web service URL.
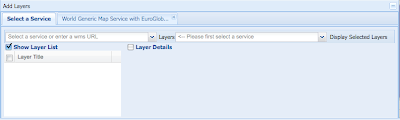
When you select a service, you get a list of available layers on it. For example in the Spanish SDI you get this:
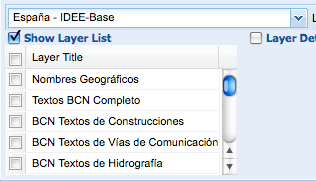
The way this work internally is by doing a getCapabilities request to the WMS server. The returned XML document list the layers available with metadata on how to query it, owner, etc.

But what happens when you have a database like the GBIF cache with 1.8 Million species? You can not create a layer per species, or the getCapabitilites document will be MB and MB impossible to parse by any client. In any case, who wants to provide a list of 1.8M species to select a layer?

Well, the way to make it work is to specify a filter on the WMS request specifying for example the species_id you are interested in. But those generic clients do not support specifying these kind of filters.

To me that means that the current status of OGC clients, like the ones used by INSPIRE, GEOSS, National SDIs, etc. are not able to handle biodiversity OGC services. Or say it in a different way, OGC services are not prepared to handle biodiversity databases with lot of species.

What are the possibilities?

1) OGC supports on their capabilities documents things like "Hey! I am not a service with a set of layers, I am a datastore with potentially millions of layers. So if you want to grab anything from me, you are going to provide a filter in your request". This will imply that OGC do some work and more important, software clients support this work. I think this will not happen in a few years.

2) Create a set of interesting layers in biodiversity. We could match our biodiversity databases against IUCN list of endangered species, create richness maps, etc, but access to primary data per species will not be possible.

If you think on the potential customers we probably should be thinking on a predefined list of layers that we could all create on our OGC services that might be interesting for lot of people. Richness, endangered species, kingdoms, whatever...

Other possibility is that we create portals where the user filter for a species and then gets a "customized,dynamic GetCapabilities document" that will include the filter on the URL. That will be possible. But with Catalog Services, like GEOSS, where there will thousands of services, is biodiversity going to be so special as for the user to go to one of our website before continuing in their wonderful world of web services workflow? I doubt it.

Next week I am going to Geoweb 09 as invited speaker to talk about Biodiversity and the challenges to share it on the Geoweb. I would love to hear what do you think about using OGC services within our community or any other issue related to geospatial data and analysis.
I would love to hear what do you think about using OGC services within our community.

Thursday, June 25, 2009

RSS feeds used by publishers

One of my current tasks is working on tools to index publications in order to find scientific names. One of the first things to figure out is how to discover publications. Many publishers provide various RSS feeds for their latest issue(s), a feature that uBio RSS is making use of, scanning about 980 journal feeds as of today.

I am trying to put some recommendations together for publishers on how to encode their RSS feeds or to use other formats to make their digital publications discoverable. If you have any recommendations I'd be glad to know about them. Especially on how to best promote back catalogues of all available publications would be interesting, as RSS feeds natively only show the latest ones (there are paging extensions for Atom, but that has no widespread support). Sitemaps or OAI-PMH seem like a good candidate, although something easier than OAI would be preferred.

Wondering which RSS format is most widely used by publishers currently and which extensions they use to encode their metadata, I wrote a little tool today that reads all current feeds known to ubio and checks their rss format, here are the results, not analyzing the namespaces and extension formats yet:


rss_0.92 = 3
rss_1.0 = 336
rss_2.0 = 431
rss_0.91U = 6
atom_1.0 = 2


So clearly the rdf based rss 1.0 (often together with Prism) and the simple rss 2.0 format is used mostly.
If there only would be a simple way to page. Maybe Microsofts Simple Sharing Extensions could help?

Visualizing Tweeter biodiversity observations

At Ebiosphere09, there was an Informatics Challenge that Rod Page won, congratulations!
Vizzuality wanted to participate but we did not find the time to work on it. During the conference we found people like @IvyMan twittering observations on biodiversity. This was part of the "The eBiosphere Real-Time Citizen Science Challenge!" which published the rules on how to tweet.

We were far too late to participate on it, but we thought it could be cool to give it a try using the new Flex 4 "Gumbo". @xavijam from Vizzuality was starting to learn Flex 4 so he took this challenge.

We make use of the Twitter API to query for the patterns explained on the challenge rules. Once we get the tweets, parse the latitude and longitude, get the scientific name of the observation and finally present it in a map together with images taken from Flickr.

If you want to make an observation appear on the app just tweet something like:

#eBio observation: #Puma_concolor /-50.412673039931825, -100.713207244873047/ method:iPhonePhotoFlying Puma Concolor

The idea is to mashup the data from Twitter together with the data from Flickr using the Darwin core machine tags. The reason for the second is that we are great supporters of people providing those tags and we created even some stickers to support them.

This is just an exercise to learn Flex 4 and promote the use of microformats and machine tags. But we hope you find it cool.

Some comments. Magically the tweets from @IvyMan on this disappeared while we were developing. Additionally there is not many machine tags in Flickr for the moment on darwin core terms, so there is some fakes over there too.

All the credit goes to @xavijam for working on it! And from his experiments we are learning that is not going to be that easy to migrate to Flex 4.


Monday, June 8, 2009

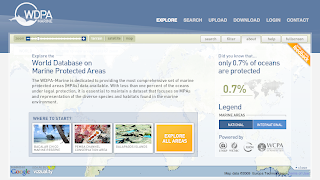
World Database on Marine Protected Areas new website

The UNEP-World Conservation Monitoring Centre (UNEP-WCMC) today unveiled  The World Database on Marine Protected Areas - a site designed to provide the most comprehensive set of Marine Protected Areas (MPAs) available.


"With less than one percent of the oceans under legal protection, i
t is essential to maintain a dataset that focuses on MPAs and representation of the diverse species and habitats found in the marine environment." is read on the website.

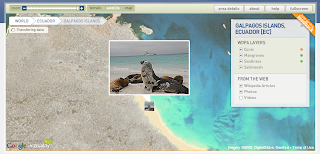
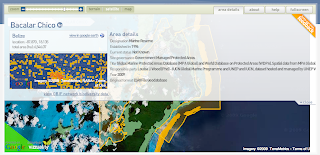
Vizzuality has developed the User Interface and general design of the website, including the logo. Working together with UNEP-WCMC, and specially Craig Mills, we have developed innovative solutions to display this huge amount of data in a hopefully engaging website to invite people explore our oceans. 

But enough of "official words", here at biodivertido we would like to explain what are the technologies behind it and how things work under the hood. 

Technologies:

The website is a mix between HTML and Flash. The Flash application in the front has been developed using the Flex framework plus some Flash little things. On the ser
ver s
ide there is ASP.NET and WebORB to do AMF remoting

GIS:
The GIS engine behind the scenes is ESRI ArcGIS Server. WCMC pr
epared the different tiles
 and caches for all layers. There is some places where we have used the new ArGIS Server REST API.

On the client side the whole project is very much based on the great Google Maps API for Flash. We want to thank Pamela Fox from Google for her great support of the community. There is several techniques that we have introduced while working on this project like:
  • Tile Mouse Over: To change the cursor when hovering over features on tiles.
  • WMS overlays: Dynamically changing the Tile Overlays based on zoom levels for cached and not cached tiles.
  • Panoramio and Wikipedia markers without proxies.
  • Encoded Polilynes for multipolygons with inner rings.
Database:
WCMC is using Microsoft SQL Server 2008 Spatial Database and we worked with them to generated Google Encoded Polylines out of the database. 
There are also some things coming from the ESRI spatial database and some stats where dones using it, but I think the general idea is to mo
ve everything to SQL Server.

Deployment:
The whole website is being served from an Amazon EC2 instance. The idea is also to make use of the Amazon Cloud Front CDN to distribute tiles and other static files, but for the moment everything is in EC2. 

We will probably post more specific details on different parts of this project in the next weeks, but we wanted to give you a broad overview of how the project works and the different technologies being used.

One more thing...
One great thing of working with UNEP-WCMC is that all the source code that we have developed is Open Source! We are still working on specific details on what license the source will get, but for those curious, starting from today you can checkout all source code from Vizzuality SVN repository. Please let us know if you find it interesting!

We are still under Beta phase of the project, so it might be that you find some bugs, please report them!.

Thanks again to UNEP-WCMC to let us work on this great project and look forward to make it better!


Saturday, June 6, 2009

Using Google Spreadsheets with Google Maps for Flash

I have recently been working on a little project that had a very simple purpose: Put in a map around 200 markers about where to find dog waste bags disposals in a town. This might have little intersection with biodiversity, but I think some of the ideas might be useful for other people.

The idea was to create a simple map/widget that could be managed by a non technical person and did not require setting up databases and hosting services. The kind of project you want to set up and forget more or less about it.

Well, the simplest thing to manage the location of the disposal is something like and spreadsheet and the internet version for that is Google Spreadsheets. I started thinking on using the Spreadsheet mapper, but it has far too much options, and we did not really need to share a KML file. So I thought creating something simpler. Just my required columns on the document and connect from Google Maps for Flash. So we wo
uld be able to just distribute the Flash SWF file and it will take 
care of connecting to Google Spreasheets, download the data and display it on the map.

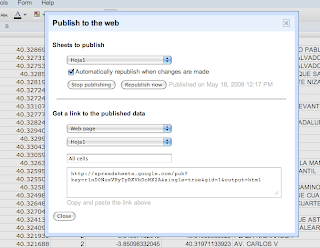
Sounds very easy no? Just publish the spreadsheet, setting automatically republish on changes, select the CSV format, and you get a perfect API to your data. Look at ours for example.
Then on the Flex app is as simple as parsing a CSV and dynamically create the needed markers.

The only problem is... Google does not like crossdomain.xml f

Therefore we were gonna have to create a proxy server to bypass the security restrictions, but we really did not like the idea of havi
ng to set up one just for this small thing and maintaining it. 

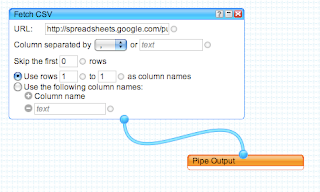
So I decided to take a look at Yahoo Pipes to bypass the crossdomain issue. You just need to create a simple Pipe that consumes the CSV from spreadhseets and output it as JSON. Yahoo pipes has an open crossdomain file, so no problems. Here is my pipe for example. Very simple and effective.

You can see the final result in here. And of course you can always grab the code from Vizzuality Google Code repository

The project had to deal also with transforming UTMs into Latitude/Longitudes and some other issues, but I think this overview is enough. The source code is so simple that I dont think its needs more explanations.

We would like to start using the Google Data API much more in the future, specially the shiny new Google Maps Data API, but I think this makes for a very simple solutions for lot of small projects like this one.

And finally, Google, please start setting up crossdomain files on your APIs, or at least, explain us why you dont do so... the actual situation is very frustrating.

Thursday, June 4, 2009

Greenpeace BlackPixel | Beautiful Idea


Today we've discovered BlackPixel. A beautiful initiative by greenpeace to save energy.
The application draws a black square in your screen that not disturb your visualization.
If you over the square, you can view how many energy is being saved.

A little effort for you, a big benefit for all.

You can know more about it here

Friday, May 29, 2009

We are going to E-biosphere 09

E-Biosphere 09 starts next Monday 1st of June on London. Today we want to announce that most of us, Tim Robertson, Sergio Alvarez, Dave Martin and Javier de la Torre, will be there.

Even more, we have a booth! GBIF & Vizzuality are joining efforts to showcase the recent projects we have been working on and some of the future ones. We are all very excited to showcase what kind of things can be done with biodiversity data and visualizations.

Tim, Sergio and Javier will be present at the booth, but we would like to be present online at the same time. Our idea is to use this blog as the online platform to present the different ideas, prototypes, wireframes, etc that we will showcase at E-biosphere 09. Especially as Andrew could not join us for London. So the blog is our online booth!

In the next few days we will be working hard on different topics, including species distribution, analyses, data integration, indexing, visualisations, taxonomy, data publishing, computing on the cloud, migration paths etc. So stay tuned to know what is going on in multiple posts that we will publish here.

Aditionally you can follow some of us on Twitter:

If you happen to attend e-biosphere please come and join us at the booth, if not we look forward to get your comments on the blog.

See you all in London!

Javier, Tim, Sergio, Dave, Andrew.