Showing posts with label biodiversityatlas. Show all posts

Saturday, November 1, 2008

Flickr creating polygons out of points, what about species distributions?

This weekend I have found a very interesting post from the Flickr programmers called The shape of Alpha. What this people are basically doing is generating shapefiles from the geotagged pictures in Flickr. When a user geotag a picture, provide lat/long, they reverse-geocode it to find the neighborhood, the town, the country etc where this coordinates are.  They store this information in the database (as  Where On Earth(WOE) IDs) and this allow for much better performance when later people search for pictures in "Madrid".

But this post talks about a different idea, and it is awesome. Now that they have all this geotagged pictures and they know they are in a particular neighborhood or country (WOEID) they are creating shapefiles from these areas based on the coordinates of the different pictures! Maybe is easier to explain it with a picture:

The one in the left is a London polygon and the right for United States. They were created by aggregating all the coordinates of the different pictures found in London and in the US.
Again. They take all the coordinates, POINTs, in the DB for a certain WOEID and with them they generate a polygon. If they have enough data it looks more or less ok. They have a good discussion about the quality of the polygons and the threshold set to generate them. I like very much the introduction they make to  Alpha shapes and the links they provide.
Additionally they also provide the source code of the tool they use to process the data. It is called Clustr.

Now, lets apply this concept to Biodiversity, if you haven't already figure it out. Think of their geotagged pictures as PRIMARY DATA, the WOE as SCIENTIFIC NAMES and the polygons you get out of them as DERIVED SPECIES DISTRIBUTION polygons.
I have been investigating this for a long time already, specially trough the Biodiversity Atlas project that is now stopped, but hopefully will start soon. We can take their source code and apply it to GBIF data and generate "derived, unchecked and uncompleted" species distributions based on GBIF data on a massive way! And the same they try in Flickr, the more primary data we get into the system the better the distributions will start looking like.

But there is another idea... why dont ask Flickr to not only process their polygons based on WOE Ids but also on tags? So if we tag pictures in Flickr with scientific names, or better GUIDs, they can then try to generate by themselves the distributions.

I particularly dont see Flickr as the best place to handle species distributions discussions, and will, hopefully, try to convince at least one big biodiversity project to let me try this way. Most of you can probably imagine the incredible API we can create once we have a lot of species distributions accessible in such a system. I will write another post about it soon, but think of:
  • Which species could live in my garden?
  • Which species habitats this new road will cross? 
  • Where should I create a new Protected Area to preserve as much biodiversity as possible?
  • What species could I find in the track I will hike this weekend?
So maybe instead of so much niche modeling projects we should start thinking on how to manage the vast amount of primary data (and other sources) we have already  and how to curate it and complete it. I dream of a scientific community joined together to create a complete information system to know where species are. Imagine like a Wikipedia but for Species Distributions.


Tuesday, July 1, 2008

BADE (Biodiversity Atlas Distribution Editor) introduction

I have been working hard in the last weeks in the Biodiversity Atlas editor. Most of the time I spent it in figuring out realistic ways to use Google Maps API with Biodiversity data. As Tim always say, we have to move from points, so here we are with Polygons! The problem is that polygons do not perform that well in web mapping interface. I end it up trying Yahoo Maps for Flash, UMap and finally Google Maps for flash. I think Google has the fastest API and I figured out more or less how to not kill the client and have a responsive interface according to the actual RIA days. Of course the technology that I am using is Flex. One of these days I have to do a post just talking what I love Flex so much, but just to justify myself I really think is the only option right now to do this semi gis applications on the web. With Flex I can handle 10 or 20 more polygons than with Javascript and I definitely feel more productive.

In any case. What is BADE? Well this project started as a subproject from Biodiversity Atlas and ended it as a stand alone project. The idea at the beginning was to create a small module for users to be able to contribute with distributions directly from the web. And I started investigating ways to let the people create distributions. With all the problems with performance I had to think a lot about data models and ways the application would be able to handle lot of data and geometries at the same time. Specially hard was the creation of grids and handling different scales or precessions, so hard that right now we sticked to 1 degree cells and look for future developments. In any case, once I had a good data model and a feasible way to draw on the map lot of data I thought this was a good start for a small application for doing Analysis! So there I focused. What are the main ideas behind:
  1. Be able to "draw" the distributions of species on a grid system.
  2. Be able to import other sources of data, like GBIF, to complete your data or to just use external data
  3. Import from CSV and Shapefiles and export to everything we can.
  4. Engage users to share their work, but not force them, in Biodiversity Atlas to create a coherent and comprehensive source of distribution data.
  5. Let people work collaboratively online like Google docs let you do or all these new incredible web 2.0 apps out there.
  6. Continuos addition of analysis tools that work out of the box with your existing data.
Most of the points are still not covered, but I wanted to release early and ask for feedback as soon as possible. What can the app do right now?
  1. Create and edit datasets.
  2. "Draw" occurrences
  3. Import data from GBIF
  4. Save the document and reload it.
Not much, but the core is already there and right now adding functionalities should be easy and fast.

So here you can see some screenshots and more important you can try the application for yourself! Please I want to hear your feedback!


Wednesday, June 25, 2008

Convex Hull over GBIF "points"

I found yesterday a post where Convex Hull was explained and the source code made available for Javascript and PHP. "The convex hull may be easily visualized by imagining an elastic band stretched open to encompass the given points; when released, it will assume the shape of the required convex hull." (from wikipedia). I talked about it months ago with Tim and I thought that would be fun to adapt it to AS3 and use it in BiodiversityAtlas. Months ago we talked that one way to create "polygons" from gbif straight points was to do a Convex Hull over them.
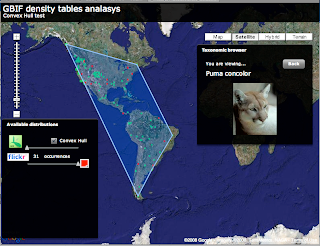
But when finished I realized it might dont make much sense... the convex hull over GBIF points always display enormous polygons over land and water that dont look very nice. Look at the next picture.
This is Puma concolor convex hull over GBIF data. Well this is exactly what a convex Hull is so I am not sure what I was expecting.

There is other types of convex hull like the Orthogonal convex hull that might make more sense in some scenarios, but in general this does not look good to me.

By the way, the convex hull algorithm i am using, quickhull, is amazingly fast.

If you want to try for yourself I have uploaded the test app for you to try. If anybody is interested in the source code let me know and I will post it.

Tuesday, June 17, 2008

Displaying Shapefiles in Google Maps for Flash (or any other AS3 mapping engine)

Recently I have been exploring different ways to let the user upload Shapefiles to a flex application and display it on Google Maps for flash or Umap. I am working on this for BiodiversityAtlas where users will be able to upload species distributions in SHP.

There are two easy options you can try:

1) Load the Shapefile natively in Flex using vanrijkom classes. Read the geometries and create overlays for the mapping api.
2) Process them in PHP using the ShapeFile.inc.php class developed by Juan Carlos Ulloa, send them, using AMFPHP,  as AS3 objects using similar to the mapping API and overlay.

I have tried both ways now. You can check the code of the first try and a demo at:

http://biodiversityatlas.com.s3.amazonaws.com/shps/shapeFileReader.html

I am still not sure which way I am gonna take for BiodiversityAtlas as both look fine to me. I probably will use the PHP way as in any case, if the user has to upload the file to the server then I can process i there anyway and I might store them directly on PostGIS even before displaying... so that looks my router.

But in any case is great to see I can go both ways and that both are surprising fast.

If anybody is interested on the PHP example please let me know. 

Wednesday, June 11, 2008

Taxonomic Browser in Flex

Last week I was playing with the Iphone and I loved its interface. While working for biodiversityatlas.com I wanted to implement some of the UI ideas for the taxonomic browser I am constructing.

The current component lacks of design, effects and a little bit of control on performance, but in general I am satisfied with it so I wanted to publish it here.

The images you see are coming from Google Images. So for every taxon it is displayed a request is sent to Google Api to look for the first image. Curiously we discovered that the results change depending in what country you are. Of course the images are not always correct but it gives a nicer way to help you navigate through higher ranks. For people like me that dont know much about the taxonomic tree it helps to find a Pinus at least!

I havent implemented much functionality when viewing a taxon detail, but this is because BiodiversityAtlas is about distributions, not so much about what data you have available for a taxon, like in the Iphone UI.

In any case this the taxonomic browser I am implementing now in BiodiversityAtlas. So please, if you like it give me some feedback :)