Showing posts with label heat map. Show all posts

Monday, March 30, 2009

SpatialKey and biodiversity primary data analysis


Some days ago the good people from Universal Mind open the beta program for their new product called SpatialKey. For those who are not in the Flex community, Universal Mind is a very recognized company developing Rich Internet Applications. So it was a great pleasure when I saw months ago that they were working on a new geospatial product for data analysis.

I was lucky to get an invitation to the beta program and be able to take a look. They are promising some great things, but for the moment the beta is limited in certain ways I will describe later. The best to get an overview of it is to watch some of their ubercool videos (maybe too much for my taste).


I wanted to give it a try as soon as possible, and coincidentally I just finished working on the new WDPA-GBIF widget. The widget allows you to visualize biodiversity primary data, from GBIF, for all protected areas in the world. Check out for example the protected areas in Australia. Then select for example an area like the Great Barrier Reef. You will be able to download the data in multiple formats.

With this I downloaded the data for the Canadian Rocky Mountains and imported it in SpatialKey. The import now is limited to 10.000 records and 25 columns, so I had to delete multiple columns and records. I think SpatialKey should allow the discard of the data visually when it is already uploaded.

With SpatialKey you manage separately your datasets and the reports you create based on them. The reports right now are not exportable to the outside. I mean, you can not print or distribute as a widget the report you have created. I know they are working on it, but for the time being I only have 2 possibilities to show you how it looks like: share my report with everybody that gives me his email, or just do a little screencast for everybody to watch here. For the first one if someone is really interested to get into the system to take a look, send me an email. the screencast is following:


So here goes the things that I like a lot:
  • The heatmaps are just gorgeous. I would love to know how they do it.
  • The timeline filter is great. Has some usability issues but is great.
  • The way grids are displayed for summaries. The hover effect is very good and the tooltip very clear.
  • The filter "pods" are nice, but I wonder what would happen when you have thousands of hundreds records to search or select on. I suppose that when there is lot of data only the search would be enabled and not the selection.
  • Great look and feel.
Other comments following:
  • Is it necessary to refresh on every map movement? I understand it is on the zoom and if you have the filter by visible area disabled.
  • Not having the possibility right now to share the reports as widgets to embed on the blog.
  • It would be nice to also let the user provide a polygon or geometry to define the boundaries of the analysis. In this case for example would help a lot to visualize the borders of the protected area.
And finally, the things I really wonder how they work internally:
  • The heatmaps!
  • The data structures they use for dynamically regrouping the data on the client.
  • If it is true that they can handle millions of records, how does the server infrastructure looks like. I know it is Java, but what about the data store, how can they handle the creation of dynamic indexes or how do they do it? Would it work with GBIF data?
My general impression of the tool is great. It looks awesome and works really well. It looks very similar to some of the ideas we have for developing analytical tools for biodiversity data with GBIF. Tim give your impressions please!

I would love to see more and more such analytical tools for biodiversity. How they call them? Something like Bussiness Intelligence, I think we need some of this in our community. For the time being I will try to get into talks with Universal Mind on the applicability of SpatialKey for huge biodiversity primary data like GBIF.

Friday, August 8, 2008

GBIF data heat maps - Heat maps over Google Maps for Flash

Maps like everything else seems to be trendy. And nowadays the sexy thing in mapping is the creation of Heat Maps. The best way to understand what they are is to see them:


You can also take a look at this post from one of my favorite blogs on what is and what is not a heat map.
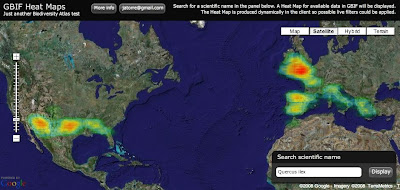
Well for long time I wanted to give it a try and yesterday I had the time to experiment a bit. The idea was to display GBIF available data as a Heat Map over Google Maps. Here you have an screenshot for Quercus ilex:

And if you want to try for yourself here it is (some usability issue, the search box is on the bottom right corner):


So how does it work? It was actually easier than I expected:

1) Get the data: I am using the so called "Density tables" from GBIF. You can access them through GBIF web services API at http://es.mirror.gbif.org/ws/rest/density . For example in a query like this one for Quercus ilex (of course you need to get the taxonconceptkey from a previous request to the services): 

This works fine but has some problems. The first one is that GBIF goes down almost every evening. Tim can maybe explain why. Thats why I am using the spanish mirror (look at the url) and I recommend you to do the same.
Second problem is the verbosity of the XML schema being used. For downloading the Animalia, well thats the biggest concept you can get probably, the result is 14.1 MB of XML. And thats just to get a list of cellIds (if anybody is interested we can post details about CellIds) with counts on them, exactly an array of 34,871 numbers. Even worst is handling them on a web client like this one, parsing such a huge xml output kills the browser. The GBIF webservices API deserve its own blog post I would say together with Tim.

But what is new is that I have supercow powers on GBIF :D I am working for GBIF right now and have access to a test database. In a testing environment I developed a little server app that publish the same density service but using the AMF protocol. I used AMFPHP for this if anybody is interested. There are two good things about using AMF: The output now is around 150 KB for the same thing and AMF is natively supported by Flash so there is no need to be parsed it goes straight into memory as AS3 Objects.

2) Create a Het Map from the data: Once the data is on the client I make use of a Class from Jordi Boggiano called HeatMap.as that creates Sprites as the result. In my case I decided to create a Spring, think like an Image, of 1 pixel per cellId creating a 360x180 pixel image (cellId is equivalent to a 1 degree box).

3) Overlay the image on Google Maps: When you have the Sprite, or even earlier but thats too many details, what you do is overlaying in Google Maps for Flash using a GroundOverlay object that takes care of the reprojection and adapting it to the map. The GroundOverlay is explained in the doc as a way to overlay images but it accepts actually any Sprite.

Done! (almost)

4) Ok, there are some problems: Yes, it is not perfect, these are the pending issues:
  • The GroundOverlay seems to not be reprojecting correctly the Sprite I generate and in the very north and south everything is not correctly overlayed.
  • The resolution of the Heat Map is a little bit poor, bu actually represent the quality of the data we have. Some interpolation could be done to make it look nicer.
  • The colours of the Heat Map do not fit well with the actual Google Maps layers. When there is small data then you can not see it almost.
I still dont feel confident with the code to release it yet. I hope I can work a little bit more on it so that i can be proud, but if you desperately need it let me know.

Just another notice. Yesterday Universal Mind released a preview of a new product: Spatial Key. I am always impressed with what this people does and follow the blogs from their developers (like this one and this one). They are kind of my RIA and web GIS heroes. The new product they have released actually look very much like what I wanted to do in Biodiversity Atlas for data anlysis. It lets people explore geographically and temporally huge datasets. Tim suggested me to contact them and I will do. Nevertheless it is great to have such a great tool available to get ideas on interaction design. Good job Universal Mind, you really rock.

We want to see your comments!

Update: 
Some people asked for different quality settings on the heat map. I have modified the application so that you get now a set of controls to define different quality and drawing options. By default the app tries to figure out depending on the number of occurrences, but maybe thats not the best, depends on how the data is dsitributed. In a final product I think I would NOT provide this functionality to the user, too much for my taste. You know, less is more.

Update 2:
There is a following post with correctly reprojected data and source here.