The European Starling is a bird native to most of temperate Europe and western Asia. I do not remember who was the first person that talked to me about it, Tim?, but since then I knew I wanted to develop something with it. The reason is funny/sad story behind it. The bird, that was only native in Europe and Asia, got introduced in lot of different places at the end of the 19th century. Since then it has spread to all continents and has been treated like a pest in lot of places, and for example, in Australia there is still efforts to prevent its introduction in the West. On the other hand in Europe it has been declining a lot, and it is now actually covered there by the Red List.
Specially appealing is the story on how it got introduced in North America. I will just quote Wikipedia for that:
Although there are approximately 200 million starlings in North America, they are all descendants of approximately 60 birds (or 100 [1]) released in 1890 in Central Park, New York, by Eugene Schieffelin, who was a member of the Acclimation Society of North America reputedly trying to introduce to North America every bird species mentioned in the works of William Shakespeare.
I knew this was a story that could really be catchy. Specially if we could use scientific primary data to show this story. While working with Tim Robertson and Andrew Hill we started thinking about using Clustr, from Flickr, to create polygons out of primary data and see if we could display this story. I demoed this in Geoweb and TDWG this year and the feedback was most of the time really good. You can watch the video at Vimeo.
The challenge for that was that there is more than 1 million observations of the starling now available on GBIF and the classical point in map did not work well, the visualizations were tedious... well, kind of complicate. But the second semester of this year we started to see interactive maps that seemed to be analyzing raster images on the fly in Flash. This is really really cool. And since then we were just thinking more and more in raster representation of data to further filter in the client and allowing much more rich story telling. And then, one day, I showed the work from Andrew Cottam from WCMC on sea level rise and Google Maps for Flash. That was awesome! And being such a nice guy he is, he publish his code and saved me the time of figuring out the bitwise operations needed for at least one band raster. I am not sure if he wants me to put a link to his ongoing work so I will wait for him to publish it first (maybe in this blog ;) ).
So I could not resist and with the help of Tim preparing the raster tiles for the starling, and Sergio doing some UI, we prepared the following demo application.
(Click the image to open)
Drag the slider from 1880 to 2010 to see the accumulative records (by date recorded) for the data available on the GBIF network. While you drag the slider you will be presented with tooltips mostly taken from Wikipedia.
Soon we will release all the source code, once a bit cleaned, and will share more technical details. And the best is yet to come... we only used one band on this demo, but we have 3 to play with!!
I hope you like it and want to share some comments.
Ah! Dont forget to turn on sound!
Showing posts with label google maps. Show all posts
Tuesday, December 15, 2009
Sunday, September 20, 2009
Using Geowebcache tiles stored in s3 from Google Maps for Flash
Last week I was in a code sprint for my next project on a very nice cottage. During the sprint I set up a Geoserver instance with Geowebcache to generate tiles from the World Database on Protected Areas. The tiles will be stored in S3 and distributed with CloudFront as the main goal is speed worldwide. The tiles will be used in a set of Maps in Flash around the project.
The biggest issue came when trying to generate a class to load the tiles from the default folder structure created by Geowebcache. I know I could have created my own tile folder structure generator for Geowebcache by creating my own BlobStore and modifying the FilePathGenerator to fir my needs, buuut i am not a Java lover and thought that it might be some good reasons why the good people at Geowebcache had use the current one.
The problem is that the structure is not very obvious, and I can imagine that it is because you dont want to have too many files within one single folder or you will start hitting the file system limits.
In order to use Google Maps for Flash you need to convert a request based on Zoom, X and Y tile coordinates, into a URL from where to get the tiles
If you use Geowebcache for accessing your tiles this is not a problem, use their gmap service and it will deliver your tile from wherever is in the file system. The issue is that I uploaded my whole geowebcache into S3 so I needed from the Flash client to know where to look for a x,y,z tile. With the help of Craig Mills we ported the code on Geowebcache to AS3.
The trickiest part was figuring out that Geowebcache starts its tiles from bottom left, while Google starts from top left. Dont know why they made this decission, but it is a bit of a pain. So tile z:1,x:0,y:0 in google is z:1,x:0,y:1 in geowebcache.
I thought it might be useful for someone that has similar needs so I have uploaded my classes here in case someone needs them.
Just a bit more information. I use the following command to trigger the tiling process:
curl -u geowebcache:secured -d “threadCount=01&type=reseed&gridSetId=EPSG:900913&format=image/png&zoomStart=00&zoomStop=08&minX=&minY=&maxX=&maxY=” http://localhost:8080/geowebcache/rest/seed/ppe:ppeblue
Remove the empty tiles generated (by looking if they are smaller than 663bytes)
find . -size -663c -type f -exec rm -f ‘{}’ \;
Remove the empty folders
find . -empty -type d -exec rm -rf ‘{}’ \;
And finally upload (well, sync) to S3
s3cmd sync —guess-mime-type —delete-removed —force —no-progress —acl-public /var/tiles/gwc/ppe_ppeblue/ s3://mybuket/ppe_ppeblue/
Saturday, June 6, 2009
Using Google Spreadsheets with Google Maps for Flash
I have recently been working on a little project that had a very simple purpose: Put in a map around 200 markers about where to find dog waste bags disposals in a town. This might have little intersection with biodiversity, but I think some of the ideas might be useful for other people.


The idea was to create a simple map/widget that could be managed by a non technical person and did not require setting up databases and hosting services. The kind of project you want to set up and forget more or less about it.
Well, the simplest thing to manage the location of the disposal is something like and spreadsheet and the internet version for that is Google Spreadsheets. I started thinking on using the Spreadsheet mapper, but it has far too much options, and we did not really need to share a KML file. So I thought creating something simpler. Just my required columns on the document and connect from Google Maps for Flash. So we wo
uld be able to just distribute the Flash SWF file and it will take
care of connecting to Google Spreasheets, download the data and display it on the map.

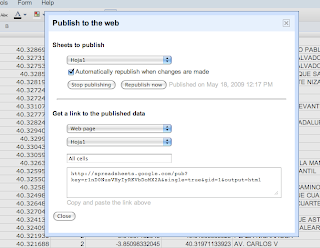
Sounds very easy no? Just publish the spreadsheet, setting automatically republish on changes, select the CSV format, and you get a perfect API to your data. Look at ours for example.
Then on the Flex app is as simple as parsing a CSV and dynamically create the needed markers.
The only problem is... Google does not like crossdomain.xml f
Therefore we were gonna have to create a proxy server to bypass the security restrictions, but we really did not like the idea of havi
ng to set up one just for this small thing and maintaining it.

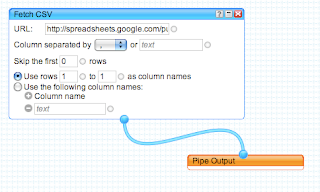
So I decided to take a look at Yahoo Pipes to bypass the crossdomain issue. You just need to create a simple Pipe that consumes the CSV from spreadhseets and output it as JSON. Yahoo pipes has an open crossdomain file, so no problems. Here is my pipe for example. Very simple and effective.
You can see the final result in here. And of course you can always grab the code from Vizzuality Google Code repository.
The project had to deal also with transforming UTMs into Latitude/Longitudes and some other issues, but I think this overview is enough. The source code is so simple that I dont think its needs more explanations.
We would like to start using the Google Data API much more in the future, specially the shiny new Google Maps Data API, but I think this makes for a very simple solutions for lot of small projects like this one.
And finally, Google, please start setting up crossdomain files on your APIs, or at least, explain us why you dont do so... the actual situation is very frustrating.
Labels:
crossdomain,
google api,
google maps,
vizzuality,
yahoo pipes
Tuesday, April 14, 2009
WMS Tiling Clients
For projects relying on open source software and using WMS services for their map applications perhaps the most obvious choice for a client application is to write something using the OpenLayers API. This is a very extensive javascript API and is used to demonstrate the open source OGC compliant servers MapServer and GeoServer. Its straight forward to construct a map and then to overlay multiple layers using WMS services.The screenshot above shows a layer of 0.1 degree cell densities representing data from Australian National Herbarium rendered using GeoServer layered on top of the Google satellite base layer, all pulled together using OpenLayers.
Running this locally the map was rendered by OpenLayers rather quickly. Running this on an externally hosted server I began to notice curious loading of tiles by OpenLayers. So I did a stripped down comparison of the same functionality using the Google maps API. Rendering the cell density tiles from a WMS service in Google maps was done using a javascript function written by John Deck - available here.
The performance improvement with Google maps was immediately obvious. Using the Firefox YSlow plugin we see:
| OpenLayers | Google Maps API |
![]() | ![]() |
So the performance difference between Google Maps and OpenLayers could be accounted for by any combination of the following:
- Incorrect use of the API (test for OpenLayers is here) and we are missing configuration to reduce tile loading in openlayers
- The tile loading algorithm for Google maps is more efficient in only loading the required tiles for selected view areas
- Openlayers is preloading more images to speed up panning. This would be good, but OpenLayers doesnt seem to prioritise the loading of currently viewed tiles.
Friday, August 8, 2008
GBIF data heat maps - Heat maps over Google Maps for Flash
Maps like everything else seems to be trendy. And nowadays the sexy thing in mapping is the creation of Heat Maps. The best way to understand what they are is to see them:


You can also take a look at this post from one of my favorite blogs on what is and what is not a heat map.
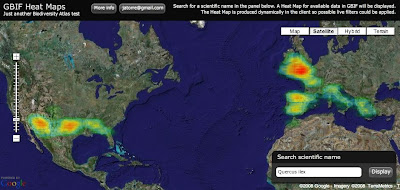
Well for long time I wanted to give it a try and yesterday I had the time to experiment a bit. The idea was to display GBIF available data as a Heat Map over Google Maps. Here you have an screenshot for Quercus ilex:

And if you want to try for yourself here it is (some usability issue, the search box is on the bottom right corner):
So how does it work? It was actually easier than I expected:
1) Get the data: I am using the so called "Density tables" from GBIF. You can access them through GBIF web services API at http://es.mirror.gbif.org/ws/rest/density . For example in a query like this one for Quercus ilex (of course you need to get the taxonconceptkey from a previous request to the services):
This works fine but has some problems. The first one is that GBIF goes down almost every evening. Tim can maybe explain why. Thats why I am using the spanish mirror (look at the url) and I recommend you to do the same.
Second problem is the verbosity of the XML schema being used. For downloading the Animalia, well thats the biggest concept you can get probably, the result is 14.1 MB of XML. And thats just to get a list of cellIds (if anybody is interested we can post details about CellIds) with counts on them, exactly an array of 34,871 numbers. Even worst is handling them on a web client like this one, parsing such a huge xml output kills the browser. The GBIF webservices API deserve its own blog post I would say together with Tim.
But what is new is that I have supercow powers on GBIF :D I am working for GBIF right now and have access to a test database. In a testing environment I developed a little server app that publish the same density service but using the AMF protocol. I used AMFPHP for this if anybody is interested. There are two good things about using AMF: The output now is around 150 KB for the same thing and AMF is natively supported by Flash so there is no need to be parsed it goes straight into memory as AS3 Objects.
2) Create a Het Map from the data: Once the data is on the client I make use of a Class from Jordi Boggiano called HeatMap.as that creates Sprites as the result. In my case I decided to create a Spring, think like an Image, of 1 pixel per cellId creating a 360x180 pixel image (cellId is equivalent to a 1 degree box).
3) Overlay the image on Google Maps: When you have the Sprite, or even earlier but thats too many details, what you do is overlaying in Google Maps for Flash using a GroundOverlay object that takes care of the reprojection and adapting it to the map. The GroundOverlay is explained in the doc as a way to overlay images but it accepts actually any Sprite.
Done! (almost)
4) Ok, there are some problems: Yes, it is not perfect, these are the pending issues:
- The GroundOverlay seems to not be reprojecting correctly the Sprite I generate and in the very north and south everything is not correctly overlayed.
- The resolution of the Heat Map is a little bit poor, bu actually represent the quality of the data we have. Some interpolation could be done to make it look nicer.
- The colours of the Heat Map do not fit well with the actual Google Maps layers. When there is small data then you can not see it almost.
I still dont feel confident with the code to release it yet. I hope I can work a little bit more on it so that i can be proud, but if you desperately need it let me know.
Just another notice. Yesterday Universal Mind released a preview of a new product: Spatial Key. I am always impressed with what this people does and follow the blogs from their developers (like this one and this one). They are kind of my RIA and web GIS heroes. The new product they have released actually look very much like what I wanted to do in Biodiversity Atlas for data anlysis. It lets people explore geographically and temporally huge datasets. Tim suggested me to contact them and I will do. Nevertheless it is great to have such a great tool available to get ideas on interaction design. Good job Universal Mind, you really rock.
We want to see your comments!
Update:
Some people asked for different quality settings on the heat map. I have modified the application so that you get now a set of controls to define different quality and drawing options. By default the app tries to figure out depending on the number of occurrences, but maybe thats not the best, depends on how the data is dsitributed. In a final product I think I would NOT provide this functionality to the user, too much for my taste. You know, less is more.
Update 2:
There is a following post with correctly reprojected data and source here.
Labels:
amf,
density,
gbif,
google maps,
heat map
Thursday, August 7, 2008
WMS Overlays in Google Maps for Flash
While working on BiodiversityAtlas I thought on overlaying distributions using a Geoserver WMS server together with Google Maps for Flash. Well, actually I started working on Umap but then moved to Google Maps. At this moment there were no examples of overlaying WMS with this mapping engines so I worked on it. Now you can find a much better work than mine for Umap here, and in this post I do the same for Google Maps.
http://biodiversityatlas.com.s3.amazonaws.com/gmapwms/GoogleMapsWMSOverlay.html

Here is the link to the demo with source code view enabled if you just want to see and get the code:

Here is the Class I created to overlay:
Basically it extends Google TileLayerBase and in the loadTile method it generates a WMS Url request converting the x,y,z parameters of tiles to ESPG:900913 . This ESPG has been created to overlay WMS in Google maps so it is aware of the different projections of Google Maps at different zoom levels, so probably you get the best overlay possible.
The trickiest part of the class was converting the x,y,z parameters into coordinates because it involves some reprojection of coordinates that I never really undertood, but that is available from different Javascript Map clients.
Still the support of WMS in Google is quite poor because of the lack of a TileLayerOverlay class on the library. So right now you have to bind your overlay to one maptype and if the user changes it then it disappear. There are hacks to emulate all basic Google MapTypes toegther with the overlay but it is a very poor solution. If you change your MapType you dont want your Overlay to ge trefreshed too. But... hopefully it will be solved soon.
The other missing thing I see is the lack of a method to enforce a redraw of the overlay. In my case the WMS overlay requests include a filter in the URL. My WMS overlay is not static, it is a database of species data, so it only make sense to visualize it with a filter specifying which species you want to see. In the application I let the user choose a species and then I change dynamically the filter in the overlayed class. Of course then I need a refresh of the Overlay but there is no way to do it through the google library. Now I am using a hack as simple as changing 1 pixel the size of the map and therefore enforcing a refresh of the layers on the map. But this is not optimal for several reasons:
- Resizing the map is SLOOOOW and the performance is horrible.
- When the map refreshed it refreshes all layers, including the ones from google that I dont want to get refreshed, I only want mines to get refreshed! The result is an ugly effect for the user.
Additionally would be great if there is a way to get noticed on when tiles had finished being
loaded for a certain Layer. This would allow to display notifications to the user on when all the
data is ready on the map. In the case of Google Tiles it is pretty obvious for the user when the
data has been loaded. You see the map or not. But in custom TileLayers with little information
on them that overlay over the map, it can be hard for the user to notice if he is seeing all the
data coming from the server.
loaded for a certain Layer. This would allow to display notifications to the user on when all the
data is ready on the map. In the case of Google Tiles it is pretty obvious for the user when the
data has been loaded. You see the map or not. But in custom TileLayers with little information
on them that overlay over the map, it can be hard for the user to notice if he is seeing all the
data coming from the server.
Hey but I am very happy in general with the Google Maps for Flash API, these guys are doing a great job and Pamela Fox (Google Employee) is very nice on the mailing list solving questions. I just wish Google would spend a little bit more resources so we get new features quicker :)
I still haven't talked about how I solved drawing thousands of polygons efficiently on the map dynamically from user input and lot of curious stuff I am doing for the BiodiversityAtlas Editor. Other thing I am working is on Heat Maps, this should be finished by the end of the week :) Keep tune!
Tuesday, June 17, 2008
Displaying Shapefiles in Google Maps for Flash (or any other AS3 mapping engine)
Recently I have been exploring different ways to let the user upload Shapefiles to a flex application and display it on Google Maps for flash or Umap. I am working on this for BiodiversityAtlas where users will be able to upload species distributions in SHP.
http://biodiversityatlas.com.s3.amazonaws.com/shps/shapeFileReader.html
There are two easy options you can try:
1) Load the Shapefile natively in Flex using vanrijkom classes. Read the geometries and create overlays for the mapping api.
2) Process them in PHP using the ShapeFile.inc.php class developed by Juan Carlos Ulloa, send them, using AMFPHP, as AS3 objects using similar to the mapping API and overlay.
I have tried both ways now. You can check the code of the first try and a demo at:

I am still not sure which way I am gonna take for BiodiversityAtlas as both look fine to me. I probably will use the PHP way as in any case, if the user has to upload the file to the server then I can process i there anyway and I might store them directly on PostGIS even before displaying... so that looks my router.
But in any case is great to see I can go both ways and that both are surprising fast.
If anybody is interested on the PHP example please let me know.
Labels:
biodiversityatlas,
flex,
gis,
google api,
google maps,
shapefile
Subscribe to:
Posts (Atom)