Showing posts with label wcmc. Show all posts

Monday, June 8, 2009

World Database on Marine Protected Areas new website

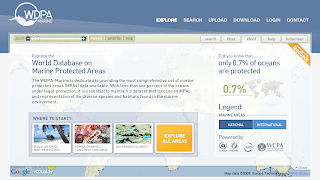
The UNEP-World Conservation Monitoring Centre (UNEP-WCMC) today unveiled  The World Database on Marine Protected Areas - a site designed to provide the most comprehensive set of Marine Protected Areas (MPAs) available.


"With less than one percent of the oceans under legal protection, i
t is essential to maintain a dataset that focuses on MPAs and representation of the diverse species and habitats found in the marine environment." is read on the website.

Vizzuality has developed the User Interface and general design of the website, including the logo. Working together with UNEP-WCMC, and specially Craig Mills, we have developed innovative solutions to display this huge amount of data in a hopefully engaging website to invite people explore our oceans. 

But enough of "official words", here at biodivertido we would like to explain what are the technologies behind it and how things work under the hood. 
Technologies:

The website is a mix between HTML and Flash. The Flash application in the front has been developed using the Flex framework plus some Flash little things. On the ser
ver s
ide there is ASP.NET and WebORB to do AMF remoting. 

GIS:
The GIS engine behind the scenes is ESRI ArcGIS Server. WCMC pr
epared the different tiles
 and caches for all layers. There is some places where we have used the new ArGIS Server REST API.

On the client side the whole project is very much based on the great Google Maps API for Flash. We want to thank Pamela Fox from Google for her great support of the community. There is several techniques that we have introduced while working on this project like:
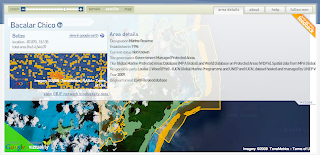
  • Tile Mouse Over: To change the cursor when hovering over features on tiles.
  • WMS overlays: Dynamically changing the Tile Overlays based on zoom levels for cached and not cached tiles.
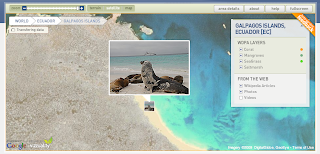
  • Panoramio and Wikipedia markers without proxies.
  • Encoded Polilynes for multipolygons with inner rings.
Database:
WCMC is using Microsoft SQL Server 2008 Spatial Database and we worked with them to generated Google Encoded Polylines out of the database. 
There are also some things coming from the ESRI spatial database and some stats where dones using it, but I think the general idea is to mo
ve everything to SQL Server.

Deployment:
The whole website is being served from an Amazon EC2 instance. The idea is also to make use of the Amazon Cloud Front CDN to distribute tiles and other static files, but for the moment everything is in EC2. 

We will probably post more specific details on different parts of this project in the next weeks, but we wanted to give you a broad overview of how the project works and the different technologies being used.

One more thing...
One great thing of working with UNEP-WCMC is that all the source code that we have developed is Open Source! We are still working on specific details on what license the source will get, but for those curious, starting from today you can checkout all source code from Vizzuality SVN repository. Please let us know if you find it interesting!

We are still under Beta phase of the project, so it might be that you find some bugs, please report them!.

Thanks again to UNEP-WCMC to let us work on this great project and look forward to make it better!


Monday, March 30, 2009

SpatialKey and biodiversity primary data analysis


Some days ago the good people from Universal Mind open the beta program for their new product called SpatialKey. For those who are not in the Flex community, Universal Mind is a very recognized company developing Rich Internet Applications. So it was a great pleasure when I saw months ago that they were working on a new geospatial product for data analysis.

I was lucky to get an invitation to the beta program and be able to take a look. They are promising some great things, but for the moment the beta is limited in certain ways I will describe later. The best to get an overview of it is to watch some of their ubercool videos (maybe too much for my taste).


I wanted to give it a try as soon as possible, and coincidentally I just finished working on the new WDPA-GBIF widget. The widget allows you to visualize biodiversity primary data, from GBIF, for all protected areas in the world. Check out for example the protected areas in Australia. Then select for example an area like the Great Barrier Reef. You will be able to download the data in multiple formats.

With this I downloaded the data for the Canadian Rocky Mountains and imported it in SpatialKey. The import now is limited to 10.000 records and 25 columns, so I had to delete multiple columns and records. I think SpatialKey should allow the discard of the data visually when it is already uploaded.

With SpatialKey you manage separately your datasets and the reports you create based on them. The reports right now are not exportable to the outside. I mean, you can not print or distribute as a widget the report you have created. I know they are working on it, but for the time being I only have 2 possibilities to show you how it looks like: share my report with everybody that gives me his email, or just do a little screencast for everybody to watch here. For the first one if someone is really interested to get into the system to take a look, send me an email. the screencast is following:


So here goes the things that I like a lot:
  • The heatmaps are just gorgeous. I would love to know how they do it.
  • The timeline filter is great. Has some usability issues but is great.
  • The way grids are displayed for summaries. The hover effect is very good and the tooltip very clear.
  • The filter "pods" are nice, but I wonder what would happen when you have thousands of hundreds records to search or select on. I suppose that when there is lot of data only the search would be enabled and not the selection.
  • Great look and feel.
Other comments following:
  • Is it necessary to refresh on every map movement? I understand it is on the zoom and if you have the filter by visible area disabled.
  • Not having the possibility right now to share the reports as widgets to embed on the blog.
  • It would be nice to also let the user provide a polygon or geometry to define the boundaries of the analysis. In this case for example would help a lot to visualize the borders of the protected area.
And finally, the things I really wonder how they work internally:
  • The heatmaps!
  • The data structures they use for dynamically regrouping the data on the client.
  • If it is true that they can handle millions of records, how does the server infrastructure looks like. I know it is Java, but what about the data store, how can they handle the creation of dynamic indexes or how do they do it? Would it work with GBIF data?
My general impression of the tool is great. It looks awesome and works really well. It looks very similar to some of the ideas we have for developing analytical tools for biodiversity data with GBIF. Tim give your impressions please!

I would love to see more and more such analytical tools for biodiversity. How they call them? Something like Bussiness Intelligence, I think we need some of this in our community. For the time being I will try to get into talks with Universal Mind on the applicability of SpatialKey for huge biodiversity primary data like GBIF.