Just a quick note to those still following.
We are planning a day and a half of presentations and hacking for those of you interested in global environmental change in the NYC area and elsewhere. We'll post more details as we get closer to the date, but start putting it on your calendars. It will be the first weekend of November, and you can find details here,
EcoHackNYC
Thursday, August 4, 2011

Monday, September 6, 2010
Biodiversity and conservation agenda at FOSS4G 2010

Nevertheless, there is still quite some Biodiversity and conservation related talks and events going on at FOSS4G and I would like to highlight from the official program a "Biodiversity and conservation agenda at FOSS4G 2010" for those interested on the topic. There is muuuch more in the program, I am just highlighting here what I believe is relevant to our community.
Tuesday 7th:
16:30
OpenLayers: SOS and INSPIRE This is not a biodiversity specific talk, but INSPIRE will likely change any Biodiversity project done in Europe, so I pick this one, as SOS is potentially one of the most realted standards to Biodiversity.
Wednesday 8th
11:00
Enhancing the European Forest Fire Information System (EFFIS) with Open Source Software
12:00
Natural Earth – Free World Base Map
The World Meteorological Oganization Information System
ecoRelevé: An open source response to the biodiversity crisis
Thursday 9th:
11:00
Open-source Earthquake and Hydrodynamic Modelling
Building the Digital Observatory for Protected Areas on an Open Source Framework
Open Environmental Services Infrastructure
We are also organizing a Break Out session for Biodiversity. Please register on the wiki so that we know how much people will be coming.
Finally maybe a list of people that I know are coming to FOSS4G and that are part of the biodiversity informatics community:
Andrew Hill - University of Colorado
Olivier Coullet - Natural solutions
Javier de la Torre - Vizzuality
I look forward to see you all there.
Monday, June 7, 2010
PhyloBox: A better way to do phylogenetic trees on the web
A few weeks ago Rod Page posted his experiments with displaying phylogenetic trees on the web using the HTML5 Canvas and JavaScript. I was particularly interested, and a bit threatened, by this post. At the time I had been toying with the exact same idea with the hopes of entering such a solution in the iEvoBio Visualization Challenge. As a response, I needed to step up my game. Here are the steps for going from a simple HTML Canvas rendering a phylogenetic tree to our end result, PhyloBox.
Step 1: Get a bigger weapon
I love tinkering with code and playing with new technologies, but I am far from the top when it comes to browser based smarts. I was going to need some help on this one. My friend Sander Pick was nice enough to spend some time tackling the problem with me. This was particularly exciting to me, as Sander has not spent much time thinking about biology on the web, getting some fresh perspective was just what this needed (in my opinion). He dove right into thinking about how to make trees, and in particular very big-trees, accessible in the HTML5 Canvas in really cool ways. Almost every time we started talking about solutions he would bring up an idea that was entirely new and exciting for this project.
Step 2: Bring trees up to speed
Phylogenetic trees are great, I love them, I have never loved their notation. Parenthetic? Might as well be punch cards. Nexus? Ok, not bad for a text-file on steroids. PhyloXML? Here we go, this might be on to something. Yet, I’m one of those people who feel like XML is sooo 2005, or maybe the year before that. What do we need to make the data within a phylogenetic tree usuable in a web application? My vote, JSON. It is simple, fast, and perfect for applications relying on JavaScript. Although it may not be able to handle some of the more complex tree notation in PhyloXML, I haven't run into that yet.
I went about creating a PhyloXML -> PhyloJSON converter and then Sander and I spent some time refining what exactly the data needed to look like to call it PhyloJSON and make it valuable for web-based visualization. I figured that what we do isn’t going to be the end-all of phylogenetic data on the web, so we have included the converter as a REST service for you to use (see here). I have near-future plans to make parenthetic->PhyloJSON and Nexus/NeXML -> PhyloJSON converters also, but would like to gather some feedback first.
PhyloJSON is primarily a conversion of the elements of phyloXML (right now a limited subset, but I'm willing to expand rapidly to match demand) to a JSON object. We changed some of the element names to reduce their length and we added a bit more top level information to define the environment (e.g. where to root the tree for viewing, what color to draw the background, where to position the tree, etc). In the process, we also flatten that tree, we weren't fond of the super nested structure of PhyloXML when we wanted to reference nodes in the trees with JavaScript very quickly. You can see the spec, here, and you can see an example of PhyloJSON here.
Step 3: Build a Web-Publishing Framework for Phylogenies
We wanted people to not only be able to view a phylogeny on the web, we also want them to be able to edit them to their liking (while still giving an option to just view). I have been doing some development on Google App Engine anyway (see GeoPhylo), so I was comfortable building the system there. I wanted to free myself from any hardware maintenance. But secondly, for reasons expanded below, I wanted to allow for a lot of requests at busy times (elasticity) without having to question my server admin skills. Finally, I wanted to take advantage of the free quotas, good amount of free data storage, and super-simple user management that comes with App Engine; users with existing Google accounts will automatically have accounts on our system.
The features of our framework are many.
Step 4: Build Better Web-Publishing Methods for Phylogenies
So now we have methods for you to control, create, and share your trees within our site. But what if you want the trees on your site? Yes, you could use our super simple ‘output image’ button and stick that image on your website. But don’t we all want something more than that? Not only do you want to show the tree on your site, you want to control the starting view (dendrogram or phylogram, branch lenth or not, camera starting angle) shown to users. You probably even want the tree being to be interactive. Okay, now you are getting pushy, we had to think about this one for a while. We knew that we had this Canvas element where we would render your tree, but how do you share a Canvas efficiently? And how do you make sure that all those JavaScript libraries are getting incorporated at the right times? And how can we continue to develop our services with the most up-to-date technologies next year, and still give you the best looking tree that you published on your website last year? Well, other people have already answered these questions.
If you look at YouTube or SlideShare, their widget always looks the same across the internet, regardless of when someone actually added it to their website. We wanted that! The problem is, we weren't going for a Flash based solution, so getting it wasn’t so straight forward. I’ll spare you a lot of the boring details on this, but we did it. After a lot of tinkering, we got a pure JavaScript widget that works in much the same way as a YouTube video. Here is an example of a PhyloBox Widget:

We wanted to make the code to add a widget to your page super small and easy to just plop in there. Much like the EMBED code you may be familiar with from a YouTube video, we achieved a nice small package. Here is the code it took to embed the widget above:
In fact, you can click the ‘open tag-end tag’ icon on the widget itself and grab the code to put in your website! The interaction with that tree isn’t perfect yet. We just haven’t had time to get mouse or gesture based control yet, but go ahead and play with your arrow keys, or your A or Z keys or shift+V keys. There are others, but a lot of the interaction is being developed, so we will be changing a lot of it shortly. What is also cool here, is that while the rending of the tree isn’t perfect yet, as we improve our methods, the widget on this page will always show the most up-to-date version.
Some small caveats. The widget works on most all personal websites, so we assume your ScratchPads page or EOL Species Page can handle it no problem (but if not, we will work to make it happen real quick). However, blogs on BlogSpot don’t really like it, in fact flat out reject it, when you stick JavaScript in your blog posts. Well, “screw that” we said. In order to get around this, we made a small Gadget for you to add to your blog, you can see it in our sidebar (just the little link to PhyloBox). It just looks for the PhyloBox Widget Div element and if it exists in the current post, pulls in the necessary JavaScript to display your tree correctly. To get it running on your blog see our help page.
What was that? A YouTube sized display is too small for you to show a tree? Yeah, good point. Well, a YouTube sized display is probably too small to show a video a lot of times too. But that is just the reality of the web, real estate is needed for all sorts of things. That is why you can control the starting size right in the small snip of code, and that is also why YouTube so kindly has that fullscreen button on every video, and so do we! How cool is that? Because we hope people plug these in all over the web, we also expect (hope for) a large number of simultaneous requests. Oh, I should mention now, we haven’t even gone as far as scratching our heads over out-dated browsers. That would be like building highways for concrete wheels, we’re just not going to do it.
Buuuuuuut... If you really hate all of this and still just want to be able to put together a phylogenetic tree for the web and just insert an image of it on your website, we've got you covered.
is just,
Or obviously you can just download the image and host it from your own site.
Step 5: Romance them with the framework, steal their hearts with the canvas
Displaying data on the canvas is easy, displaying information on the canvas is less easy, adding interaction and user control to that information is downright nutty fun. I used my previous experience drawing phylogenies (GeoPhylo) to do a first pass implementation to just display a tree on the canvas. Following that, Sander and I had a couple of build up sessions to figure out what exactly Version 1.0 should include. It was a lot. Primarily though, we wanted several different view types: Phylogram, Dendrogram, Circular-Dendrogram, and 3D. We also wanted to be able to display very big trees in useful ways that transition to more the more familar views (dendrogram or phylogram) when only a small part is within view. And we wanted a handful of tools to be ready from the get-go, but the ability to add a lot more as we move forward.
Sander began writing a rendering engine for the trees. The idea was one engine for all view types, 3D or 2D. A few days later I went by his house for a beer and he showed me the engine at work. At that point he was trying to push 1000 node+branch objects into the canvas, spinning, at up to 60fps with shading. It was on.
We toned it back for display on our site to ~12fps and in a widget to just 8fps. This will keep a blog post with a couple tree widgets from completely sucking up all your CPU. Then engine is incredibly efficient though. We can render the tree in 3D in your browser and give you complete control over the editing tools and display of that tree. If you would like to see an example of a big tree, see the Frost et al. (2006) Amphibian tree (see phyloxml.org) rendered in your browser, here
Another exciting thing we did was add support for URIs in the nodes. This is built into phyloXML and we incorporated it into our phyloJSON. By enabling the URI tool in the editor, a user can link from a node to a GenBank record, a video, an image or anything you like. This tree has a few URI nuggets for you to discover (you must enable the URI tooltip and select the primary URI first).
The engine also allows for multiple tree objects on the same canvas, although we haven’t unlocked this feature on the site yet.
Conclusion: PhyloBox
We made PhyloBox flexible enough that you can use it from afar to just display your data or you can dive in and use all these features. We have already been thinking of some other important features to add if people like it. For example, why draw your tree once for publication and once for the web? We are working on export of high quality TIFFs or SVGs directly from the browser, for now PNGs will have to do. You like that? Well how about publishing a link to your interactive tree right in your paper? How about publishing the Widget itself right in a PlosOne paper? You don’t want people to fork your project? We are thinking about adding an opt-out option, but frankly don’t like it, it seems anti-scientific. We would like to hear your feedback on this one, maybe we could let you opt-out for only a limited amount of time (say 1 year) for a tree? You want to develop something home-grown to display a tree you customized on PhyloBox? You got it, use our lookup service to just retrieve the PhyloJSON object for one of your trees. Want commenting on trees? We can do that, just need to know the demand. We were thinking of having commenting on individual nodes, branches, or trees. I know having only phyloXML support can be a drag, I should have at least a Newick converter and upload available in the next week.
We really hope people like the PhyloBox concept. If not, we’d like to hear that too, because we need to know if you want us to develop this into the future. PhyloBox is somewhere around Beta, but the iEvoBio deadline is right now, so that is that. There is so much more we can add to this!
Step 1: Get a bigger weapon
I love tinkering with code and playing with new technologies, but I am far from the top when it comes to browser based smarts. I was going to need some help on this one. My friend Sander Pick was nice enough to spend some time tackling the problem with me. This was particularly exciting to me, as Sander has not spent much time thinking about biology on the web, getting some fresh perspective was just what this needed (in my opinion). He dove right into thinking about how to make trees, and in particular very big-trees, accessible in the HTML5 Canvas in really cool ways. Almost every time we started talking about solutions he would bring up an idea that was entirely new and exciting for this project.
Step 2: Bring trees up to speed
Phylogenetic trees are great, I love them, I have never loved their notation. Parenthetic? Might as well be punch cards. Nexus? Ok, not bad for a text-file on steroids. PhyloXML? Here we go, this might be on to something. Yet, I’m one of those people who feel like XML is sooo 2005, or maybe the year before that. What do we need to make the data within a phylogenetic tree usuable in a web application? My vote, JSON. It is simple, fast, and perfect for applications relying on JavaScript. Although it may not be able to handle some of the more complex tree notation in PhyloXML, I haven't run into that yet.
I went about creating a PhyloXML -> PhyloJSON converter and then Sander and I spent some time refining what exactly the data needed to look like to call it PhyloJSON and make it valuable for web-based visualization. I figured that what we do isn’t going to be the end-all of phylogenetic data on the web, so we have included the converter as a REST service for you to use (see here). I have near-future plans to make parenthetic->PhyloJSON and Nexus/NeXML -> PhyloJSON converters also, but would like to gather some feedback first.
PhyloJSON is primarily a conversion of the elements of phyloXML (right now a limited subset, but I'm willing to expand rapidly to match demand) to a JSON object. We changed some of the element names to reduce their length and we added a bit more top level information to define the environment (e.g. where to root the tree for viewing, what color to draw the background, where to position the tree, etc). In the process, we also flatten that tree, we weren't fond of the super nested structure of PhyloXML when we wanted to reference nodes in the trees with JavaScript very quickly. You can see the spec, here, and you can see an example of PhyloJSON here.
Step 3: Build a Web-Publishing Framework for Phylogenies
We wanted people to not only be able to view a phylogeny on the web, we also want them to be able to edit them to their liking (while still giving an option to just view). I have been doing some development on Google App Engine anyway (see GeoPhylo), so I was comfortable building the system there. I wanted to free myself from any hardware maintenance. But secondly, for reasons expanded below, I wanted to allow for a lot of requests at busy times (elasticity) without having to question my server admin skills. Finally, I wanted to take advantage of the free quotas, good amount of free data storage, and super-simple user management that comes with App Engine; users with existing Google accounts will automatically have accounts on our system.
The features of our framework are many.
- Anonymous tree viewing. This allows users to use our technology without the need to actually sign-in or authenticate. So, for example, our REST services will take either a PhyloXML file or PhyloJSON file (zip supported for big ones), and return all the needed bits to view that tree on the web without any authentication (we are working on OAuth as well though for greater control including versioning and stored tree defaults). You can even use our tree editor anonymously (although there are some good bits you might like to sign-in for).
- User based project management. This allows users to save and return to phylogenetic trees that they own. It also allows users to invite collaborators to edit the same tree. Or fork their tree into a new version, preserving the older ones to track progress or changes and track how many much the tree is being viewed.
- Creative commons publishing. The system is open from the start. This may scare you, but let me explain. When a tree is uploaded to our site, it is assigned a UUID. If you know the UUID, you can see the tree, but can’t edit it unless you own it. That means that you can share the URL with anyone you want, but because the UUID has 16^32 combinations, no one should stumble upon it. This is a very similar method to the one that Google Docs uses if you use their ‘Get the link to share’ option. This will ensure that you can use the tree that you own for anything you darn well please.
- Project forking. This is something we are excited about, and hope it doesn’t make you run the other way. If you share a link to a tree with me, but I am not an owner or collaborator on that tree, I can’t edit it. That’s too bad because I may want to show you some other branch coloring scheme that would look better, or convey the data better. In the spirit of science, we made it so that I can fork the project. When I fork it, I get a completely new UUID to a new tree object with all the same info, which I can edit and re-share with you. The history of ownership and contribution is maintained. You will always be the original author, and if anyone forks the tree that I made from yours, you are still original author. The entire ‘lineage’ of that tree is also kept so that we can reconstruct where changes came from who added what. Cool? Here is an figure of the concept.

- Project management console. This aspect is far from complete, but in this area, we will give original authors ways of seeing where there idea has gone, see how often it is being viewed etc. For now, you can see a list of your trees and number of views.
- A growing API, where advanced users can take advantage of each part of our system, without any use of the graphical UI.

Step 4: Build Better Web-Publishing Methods for Phylogenies
So now we have methods for you to control, create, and share your trees within our site. But what if you want the trees on your site? Yes, you could use our super simple ‘output image’ button and stick that image on your website. But don’t we all want something more than that? Not only do you want to show the tree on your site, you want to control the starting view (dendrogram or phylogram, branch lenth or not, camera starting angle) shown to users. You probably even want the tree being to be interactive. Okay, now you are getting pushy, we had to think about this one for a while. We knew that we had this Canvas element where we would render your tree, but how do you share a Canvas efficiently? And how do you make sure that all those JavaScript libraries are getting incorporated at the right times? And how can we continue to develop our services with the most up-to-date technologies next year, and still give you the best looking tree that you published on your website last year? Well, other people have already answered these questions.
If you look at YouTube or SlideShare, their widget always looks the same across the internet, regardless of when someone actually added it to their website. We wanted that! The problem is, we weren't going for a Flash based solution, so getting it wasn’t so straight forward. I’ll spare you a lot of the boring details on this, but we did it. After a lot of tinkering, we got a pure JavaScript widget that works in much the same way as a YouTube video. Here is an example of a PhyloBox Widget:
We wanted to make the code to add a widget to your page super small and easy to just plop in there. Much like the EMBED code you may be familiar with from a YouTube video, we achieved a nice small package. Here is the code it took to embed the widget above:
<div id="PhyloboxEmbed" >
   <div width="375" height="344" style="width:375px;height:344px;" id="phylobox_phylobox-1-0-ecfa61d1-db2b-49a3-9c05-8f4f682e68d9" class="phylobox_embed_parent"><a href="http://phylobox.appspot.com"><img src="http://phylobox.appspot.com/api/image.png?k=phylobox-1-0-ecfa61d1-db2b-49a3-9c05-8f4f682e68d9" width="375" height="344" /></a>
   </div>
</div>
In fact, you can click the ‘open tag-end tag’ icon on the widget itself and grab the code to put in your website! The interaction with that tree isn’t perfect yet. We just haven’t had time to get mouse or gesture based control yet, but go ahead and play with your arrow keys, or your A or Z keys or shift+V keys. There are others, but a lot of the interaction is being developed, so we will be changing a lot of it shortly. What is also cool here, is that while the rending of the tree isn’t perfect yet, as we improve our methods, the widget on this page will always show the most up-to-date version.
Some small caveats. The widget works on most all personal websites, so we assume your ScratchPads page or EOL Species Page can handle it no problem (but if not, we will work to make it happen real quick). However, blogs on BlogSpot don’t really like it, in fact flat out reject it, when you stick JavaScript in your blog posts. Well, “screw that” we said. In order to get around this, we made a small Gadget for you to add to your blog, you can see it in our sidebar (just the little link to PhyloBox). It just looks for the PhyloBox Widget Div element and if it exists in the current post, pulls in the necessary JavaScript to display your tree correctly. To get it running on your blog see our help page.
What was that? A YouTube sized display is too small for you to show a tree? Yeah, good point. Well, a YouTube sized display is probably too small to show a video a lot of times too. But that is just the reality of the web, real estate is needed for all sorts of things. That is why you can control the starting size right in the small snip of code, and that is also why YouTube so kindly has that fullscreen button on every video, and so do we! How cool is that? Because we hope people plug these in all over the web, we also expect (hope for) a large number of simultaneous requests. Oh, I should mention now, we haven’t even gone as far as scratching our heads over out-dated browsers. That would be like building highways for concrete wheels, we’re just not going to do it.
Buuuuuuut... If you really hate all of this and still just want to be able to put together a phylogenetic tree for the web and just insert an image of it on your website, we've got you covered.
is just,
<img src="http://phylobox.appspot.com/api/image.png?k=phylobox-1-0-ecfa61d1-db2b-49a3-9c05-8f4f682e68d9" style="max-width:300px; max-height:300px;" />
Or obviously you can just download the image and host it from your own site.
Step 5: Romance them with the framework, steal their hearts with the canvas
Displaying data on the canvas is easy, displaying information on the canvas is less easy, adding interaction and user control to that information is downright nutty fun. I used my previous experience drawing phylogenies (GeoPhylo) to do a first pass implementation to just display a tree on the canvas. Following that, Sander and I had a couple of build up sessions to figure out what exactly Version 1.0 should include. It was a lot. Primarily though, we wanted several different view types: Phylogram, Dendrogram, Circular-Dendrogram, and 3D. We also wanted to be able to display very big trees in useful ways that transition to more the more familar views (dendrogram or phylogram) when only a small part is within view. And we wanted a handful of tools to be ready from the get-go, but the ability to add a lot more as we move forward.
Sander began writing a rendering engine for the trees. The idea was one engine for all view types, 3D or 2D. A few days later I went by his house for a beer and he showed me the engine at work. At that point he was trying to push 1000 node+branch objects into the canvas, spinning, at up to 60fps with shading. It was on.
We toned it back for display on our site to ~12fps and in a widget to just 8fps. This will keep a blog post with a couple tree widgets from completely sucking up all your CPU. Then engine is incredibly efficient though. We can render the tree in 3D in your browser and give you complete control over the editing tools and display of that tree. If you would like to see an example of a big tree, see the Frost et al. (2006) Amphibian tree (see phyloxml.org) rendered in your browser, here
Another exciting thing we did was add support for URIs in the nodes. This is built into phyloXML and we incorporated it into our phyloJSON. By enabling the URI tool in the editor, a user can link from a node to a GenBank record, a video, an image or anything you like. This tree has a few URI nuggets for you to discover (you must enable the URI tooltip and select the primary URI first).
The engine also allows for multiple tree objects on the same canvas, although we haven’t unlocked this feature on the site yet.
Conclusion: PhyloBox
We made PhyloBox flexible enough that you can use it from afar to just display your data or you can dive in and use all these features. We have already been thinking of some other important features to add if people like it. For example, why draw your tree once for publication and once for the web? We are working on export of high quality TIFFs or SVGs directly from the browser, for now PNGs will have to do. You like that? Well how about publishing a link to your interactive tree right in your paper? How about publishing the Widget itself right in a PlosOne paper? You don’t want people to fork your project? We are thinking about adding an opt-out option, but frankly don’t like it, it seems anti-scientific. We would like to hear your feedback on this one, maybe we could let you opt-out for only a limited amount of time (say 1 year) for a tree? You want to develop something home-grown to display a tree you customized on PhyloBox? You got it, use our lookup service to just retrieve the PhyloJSON object for one of your trees. Want commenting on trees? We can do that, just need to know the demand. We were thinking of having commenting on individual nodes, branches, or trees. I know having only phyloXML support can be a drag, I should have at least a Newick converter and upload available in the next week.
We really hope people like the PhyloBox concept. If not, we’d like to hear that too, because we need to know if you want us to develop this into the future. PhyloBox is somewhere around Beta, but the iEvoBio deadline is right now, so that is that. There is so much more we can add to this!
Wednesday, April 14, 2010
FOSS4G and Biodiversity International Year

I am not sure if there is enough people on the biodiversity informatics/conservation community that knows about the great conference on Open Source and GIS FOSS4G.
Most of us are already using great Open Source software for GIS. For example Geoserver, PostGIS, Quantum GIS,gvSIG, GRASS, OpenLayers, GDAL/OGR, MapServer and many more. This is the conference were all those developers meet. The conference include Workshops, tutorials and presentations. The level of the program is just amazing. Let me show you some of the ones of my own interest:
T-08: How to generate billions of tiles using distributed cloud-computing
T-11: Standardized geoprocessing with 52°north open source software
W-14: Practical introduction to GRASS
W-09: Quantum GIS and PostGIS: Solving spatial problems and creating web-based analysis tools
Or take a look at last year presentations to get excited on the great topics that are discussed on this conference.
So I really would like you to consider attending this great conference and participate on the Open Source movement on GIS.
But more important. In this International year on Biodiversity, I would like to get something organized around Biodiversity/Conservation and Open Source Geospatial software. I truly believe that GIS Open Source software is enabling the development of lot of our initiatives, and without it handling biodiversity knowledge would just be impossible.
The idea is to have enough people attending from this community to create a side event specific to biodiversity. Last year for example they created one event around interoperability of projects on Climate
Change. What about something similar for biodiversity?
The deadline for paper submissions and presentations is in 2 days, I know it is tight, and it would help me a lot to get support from the organizers if we get a decent submission on biodiversity/conservation
topics.
Considering that Biodiversity is deeply linked to Geospatial information I think it could be a great venue to push the requirements from our community into the development of Open Source GIS that most
of us are using anyway.
I have contacted organizers and they are willing to organize a side event for Biodiversity/Conservation, but they just need to know there is enough people interested on it.
I have sent multiple messages to different people and list that I know could be interested and I am getting already lot of answers of people that are gonna be submitting abstracts. I will try to collect all of them in this post so that we can see how the community will be represented.
Additionally if it is possible for you consider supporting the event as a sponsor or providing an official letter of support for the initiative.
Finally. We still need to decide what kind of event we will like to see there. Presentations, an interoperability test (like last year Climate Challenge Integration Plugfest)... we decide.
Looking forward to see lot of people from the community in Barcelona!
Tuesday, December 15, 2009
Recreating the European Starling story

Specially appealing is the story on how it got introduced in North America. I will just quote Wikipedia for that:
Although there are approximately 200 million starlings in North America, they are all descendants of approximately 60 birds (or 100 [1]) released in 1890 in Central Park, New York, by Eugene Schieffelin, who was a member of the Acclimation Society of North America reputedly trying to introduce to North America every bird species mentioned in the works of William Shakespeare.

The challenge for that was that there is more than 1 million observations of the starling now available on GBIF and the classical point in map did not work well, the visualizations were tedious... well, kind of complicate. But the second semester of this year we started to see interactive maps that seemed to be analyzing raster images on the fly in Flash. This is really really cool. And since then we were just thinking more and more in raster representation of data to further filter in the client and allowing much more rich story telling. And then, one day, I showed the work from Andrew Cottam from WCMC on sea level rise and Google Maps for Flash. That was awesome! And being such a nice guy he is, he publish his code and saved me the time of figuring out the bitwise operations needed for at least one band raster. I am not sure if he wants me to put a link to his ongoing work so I will wait for him to publish it first (maybe in this blog ;) ).
So I could not resist and with the help of Tim preparing the raster tiles for the starling, and Sergio doing some UI, we prepared the following demo application.

Drag the slider from 1880 to 2010 to see the accumulative records (by date recorded) for the data available on the GBIF network. While you drag the slider you will be presented with tooltips mostly taken from Wikipedia.
Soon we will release all the source code, once a bit cleaned, and will share more technical details. And the best is yet to come... we only used one band on this demo, but we have 3 to play with!!
I hope you like it and want to share some comments.
Ah! Dont forget to turn on sound!
Monday, November 16, 2009
Amazon EC2, EBS RAID-0 & PostGIS build script
EC2's dirty secret
Javier's post was a great tutorial on building out a PostGIS database on Amazon EC2. We all know EC2, but it does have it's drawbacks and they are mainly related to disk IO. When using EC2 & EBS with large datasets you can easily run into IO bottlenecks. Individually these are not such a big deal, but when you are conducting global analyses poor disk IO on EC2 & EBS can quickly become a problem.Clean living?
To help alleviate this, there is a trend of people stringing together EBS volumes and creating their own software RAID-0 arrays to achieve higher read and write throughput.
Nope, a Bash script.
I pieced together bits and bobs to create a script that builds out a PostGIS database on an n-volume RAID array on EC2. It's pretty simple stuff, but should mean that instead of hours, you can get your 20 volume RAID-0 PostGIS test rig up and running in minutes.
You can grab it from Github:
Monday, November 9, 2009
Automated informatics pipelines, public datasets, and the cloud
Although Biodivertido typically focuses on biodiversity informatics, I'm going to step it back to informatics of another stripe in the hopes of making a few points and getting people primed for Javier's TDWG talk Moving Biodiversity to the Cloud on Friday.
A couple of days ago I became curious if I could use CloudBurst to compare novel influenza sequences to the entire known sequence record of influenza in the hopes of detecting novel reassortants on the fly. The intended use of CloudBurst is to take small sequence reads from high throughput sequencing projects and query them against a complete genome a variety of reasons including SNP discovery, genotyping and personal genomics1. So why not take a novel influenza and break it up into many small overlapping fragments and query them against a genome comprised of all known sequences to detect reassortment?
A couple of days ago I became curious if I could use CloudBurst to compare novel influenza sequences to the entire known sequence record of influenza in the hopes of detecting novel reassortants on the fly. The intended use of CloudBurst is to take small sequence reads from high throughput sequencing projects and query them against a complete genome a variety of reasons including SNP discovery, genotyping and personal genomics1. So why not take a novel influenza and break it up into many small overlapping fragments and query them against a genome comprised of all known sequences to detect reassortment?
Comparisons similar to these can likely be done using some manipulation of the Blast or similar algorithm. But in my case, I was particularly interested in CloudBurst because of its available implementation in EC2 using Hadoop to utilise the cluster environment. This means that if successful I could later wrap my method into an automated workflow for detecting and reporting potentially novel influenza reassortants as soon as new sequences are reported.
I posted an overview of the steps it took below. In the end, as a first pass detection of reassortment it appears promising or at least interesting. All in all, I went from idea, to data assembly, to trial implementation in about 2 hours (not counting a few hours trying to get Hadoop to run the CloudBurst.jar. Hadoop version number = VERY important). That is great for the study of influenza, but what about biodiversity informatics?
There are a few things that made this so simple.
First, a rapid adoption of EC2 by the bioinformatics community. Look for example at the JVCI maintained Bio-linux distribution for use on EC2. It comes prepackaged with a whole smörgåsbord of very fun little tools. It costs 34 cents per hour (not 10 because it requires a 64-bit instance) and takes about 1 minute to set up your very own copy. Where is our (the biodiversity informatics community's) GISing, niche modeling, distribution mapping, PDing, SGAing, Hadoop spatial joining, machine image?
Second, a growing community of users who are exchanging knowledge about how to tackle these very large datasets in the cloud. Biodiversity informatics is growing its own such community, writers of this blog can attest to that.
Third, cloud hosted datasets. Amazon Web Services is making it fairly simple to host very large datasets that anyone in the community can access. The GenBank image is ~200gb and takes 5 minutes to set up as a mounted volume for my own use. This targets a completely different consumer then our data portals and APIs. It opens up the data for the community of informatics enthusiasts doing cool things on the cloud (think spelling correction, retrospective georeferencing, spatial joining).
With all that said I'd like to return to think about how this relates to biodiversity informatics. I've been talking with a variety of people over the past few weeks and all of them show some level of interest in moving to the cloud. What I'm worried about now is that we will adopt many of the same stances as a community as we have had without the cloud. The case study I developed above relied heavily on easily accessible data and tools. We as a community must move forward with this as a primary goal. Likely, there will always be a need for portals and APIs, but for really big questions sometimes it is just easier to have the entire dataset ready for access. Why hasn't our community got it together enough to launch a unified public dataset in the cloud?
I guess data quality concerns and ownership are two primary concerns. I'm sorry, but those are bad reasons, time to grow up, it isn't 2001 any longer.
Once in place we can begin to build new methods (or reapply existing ones) for parsing out duplicate records, linking data to geographic areas, merging error types into targeted datasets, and sharing findings with the owners of the original data. The 'snapshot' approach as implemented in AWS Public Data Set makes it so we consumers constantly rely on the original providers to include the newest and most up to date records, none of our hard work will be included in future snapshots if we don't come up with methods for reporting corrections to the source.
It is important to restate, I don't think portals and APIs will go away. They are for two completely different consumer communities than those interested in looking at the entire dataset at once, versus pulling smaller subsets of data manually or developing tools to do so via API interfaces. I do think that by providing public datasets, new methods and technologies for enhancing the portals and APIs will arise, as well as still unknown methods for improving the datasets at source, and ultimately enhancing our knowledge about the world's biodiversity.
After downloading Hadoop (version 0.18.3), here is what I ran.
Launch Hadoop cluster, create and mount a volume containing the GenBank influenza data
>src/contrib/ec2/bin/hadoop-ec2 launch-cluster cloud 5
>ec2-create-volume --snapshot snap-fe3ec297 -z us-east-1d
>ec2-attach-volume vol-7b49a612 -i
MASTERNODEIDHERE -d /dev/sdh >src/contrib/ec2/bin/hadoop-ec2 login cloud
$mkdir /inf
$mount /dev/sdh /inf
Here I ran a small Python script to extract all sequences (hemagluttanin only) known prior to the original swine flu outbreak, concatenate those sequences into a single “genome” saved as data/genome.fa, and recording a map of where in the genome each sequence ended.
Next, a group of sequences (again, hemagluttanin only) from the earliest swine flu outbreaks were broken up into numerous overlapping fragments and saved as data/segs.fa, again keeping a map of where each fragment belonged. These are the 'novel sequences' I would test for any cases of reassortment.
Download and extract CloudBurst
$wget http://downloads.sourceforge.net/project/cloudburst-bio/cloudburst/CloudBurst-1.0.1/CloudBurst-1.0.1.tgz
$tar xzf CloudBurst-1.0.1.tgz
$mv CloudBurst-1.0.1/ data/
Convert fasta files to Hadoop ready files
$java -jar data/ConvertFastaForCloud.jar data/genome.fa data/genome.br
$java -jar data/ConvertFastaForCloud.jar data/segs.fa data/segs.br
Move the data to hdfs
$/usr/local/hadoop-0.17.0/bin/hadoop fs -put ~/data /data
Run the analysis
$/usr/local/hadoop-0.17.0/bin/hadoop jar ~/data/CloudBurst.jar /data/genomeA.br /data/segsA.br /results 40 3 0 1 50 15 5 5 128 5
Copy results from hdfs
$/usr/local/hadoop-0.17.0/bin/hadoop fs -get /results results
Convert the results back to human readable format
java -jar data/PrintAlignments.jar results >results.txt
Profit!
Parsing meaning out of the results was a bit more labor intensive and I forewent any automation (for now), using OpenOffice spreadsheets to map matched portions back to their original viruses and report accession numbers. What I found was interesting, exciting and promissing, even matching some of the findings reported in Kingsford et al., 2009, from only 2 hours of work and a couple of dollars. I was pretty satisfied.
Wednesday, October 21, 2009
Install PostgreSQL 8.4 and PostGIS 1.4.0 in Ubuntu 9.0.4
I am a big fan of the new PostGIS 1.4.0 (and also of Paul Ramsey) . I always have troubles installing PostGIS in ubuntu so I thought that this time I was gonna document it and blog it here. So this is just a log of the steps required to install it on an EC2 instance with Ubuntu 9.04. I hope it can be useful for someone else.
Just for the record. The EC2 instance I used was ami-ccf615 from http://alestic.com .
Once login (totally fresh).
Good Luck!
Just for the record. The EC2 instance I used was ami-ccf615 from http://alestic.com .
Once login (totally fresh).
apt-get update
apt-get install vim
#The sources are still not available on the regular package servers... edit the sources
vim /etc/apt/sources.list
  add deb http://ppa.launchpad.net/pitti/postgresql/ubuntu jaunty main
          deb-src http://ppa.launchpad.net/pitti/postgresql/ubuntu jaunty main

sudo apt-key adv --keyserver keyserver.ubuntu.com --recv-keys 8683D8A2
sudo apt-get update
sudo apt-get install postgresql-8.4
#This changes the port from 5433 to 5432
sudo sed -i.bak -e 's/port = 5433/port = 5432/' /etc/postgresql/8.4/main/postgresql.conf

sudo /etc/init.d/postgresql-8.4 stop
sudo /etc/init.d/postgresql-8.4 start
apt-get install postgresql-server-dev-8.4 libpq-dev
apt-get install libgeos-dev
wget http://postgis.refractions.net/download/postgis-1.4.0.tar.gz
apt-get install proj
tar xvfz postgis-1.4.0.tar.gz
cd postgis-1.4.0
./configure
make
make install
sudo su postgres
#change the postgres password to "atlas" so that you can later login
psql -c"ALTER user postgres WITH PASSWORD 'atlas'"

createdb geodb    (with password atlas)
createlang -dgeodb plpgsql
psql -dgeodb -f /usr/share/postgresql/8.4/contrib/postgis.sql
psql -dgeodb -f /usr/share/postgresql/8.4/contrib/spatial_ref_sys.sql
psql -dgeodb -c"select postgis_lib_version();"
#This should return 1.4.0exitSunday, September 20, 2009
Using Geowebcache tiles stored in s3 from Google Maps for Flash
Last week I was in a code sprint for my next project on a very nice cottage. During the sprint I set up a Geoserver instance with Geowebcache to generate tiles from the World Database on Protected Areas. The tiles will be stored in S3 and distributed with CloudFront as the main goal is speed worldwide. The tiles will be used in a set of Maps in Flash around the project.
The biggest issue came when trying to generate a class to load the tiles from the default folder structure created by Geowebcache. I know I could have created my own tile folder structure generator for Geowebcache by creating my own BlobStore and modifying the FilePathGenerator to fir my needs, buuut i am not a Java lover and thought that it might be some good reasons why the good people at Geowebcache had use the current one.
The problem is that the structure is not very obvious, and I can imagine that it is because you dont want to have too many files within one single folder or you will start hitting the file system limits.
In order to use Google Maps for Flash you need to convert a request based on Zoom, X and Y tile coordinates, into a URL from where to get the tiles
If you use Geowebcache for accessing your tiles this is not a problem, use their gmap service and it will deliver your tile from wherever is in the file system. The issue is that I uploaded my whole geowebcache into S3 so I needed from the Flash client to know where to look for a x,y,z tile. With the help of Craig Mills we ported the code on Geowebcache to AS3.
The trickiest part was figuring out that Geowebcache starts its tiles from bottom left, while Google starts from top left. Dont know why they made this decission, but it is a bit of a pain. So tile z:1,x:0,y:0 in google is z:1,x:0,y:1 in geowebcache.
I thought it might be useful for someone that has similar needs so I have uploaded my classes here in case someone needs them.
Just a bit more information. I use the following command to trigger the tiling process:
curl -u geowebcache:secured -d “threadCount=01&type=reseed&gridSetId=EPSG:900913&format=image/png&zoomStart=00&zoomStop=08&minX=&minY=&maxX=&maxY=” http://localhost:8080/geowebcache/rest/seed/ppe:ppeblue
Remove the empty tiles generated (by looking if they are smaller than 663bytes)
find . -size -663c -type f -exec rm -f ‘{}’ \;
Remove the empty folders
find . -empty -type d -exec rm -rf ‘{}’ \;
And finally upload (well, sync) to S3
s3cmd sync —guess-mime-type —delete-removed —force —no-progress —acl-public /var/tiles/gwc/ppe_ppeblue/ s3://mybuket/ppe_ppeblue/
Friday, August 14, 2009
Presentation at Geoweb 09: Biodiversity: Where is important

I was a invited speaker at this year Geoweb 09 conference in Vancouver. This year the conference was focus on Cityscapes. Kind of trying to figure out how the geoweb could help on urban infrastructure on cities and things like that. It was curious that someone like me, focus mainly on biodiversity, got invited as a speaker there. But considering that cities have a huge effect on biodiversity, I think it was great to be there to offer some perspective on what we are doing in Biodiversity Informatics in relation with the geoweb. Hopefully some people got the idea of openness of this community, what primary data is and how are we sharing it. Here is my presentation on slideshare and links to videos on youtube (in 5 parts).
The conference was great and some people claim it was very hot, but really, these people dont know what a hot summer is if they havent been in August in Madrid.
I specially enjoyed meeting with Aaron Cope from Flickr, Paul Ramsey from PostGIS team and lot of different people there.
I might start getting into the discussion on how biodiversity informatics can better share their data to better play on the geoweb, specially since there is some great discussion going on. Related to why OGC does not work with us is the question on how we can more effectively share our data so that it better plays on the Geoweb.
Finally I think it is interesting if more people from biodiversity informatics start getting into this issue and this conference is a great place to discuss them. So, hopefully next year I will not be the only one talking about biodiversity at Geoweb 10!
Friday, July 3, 2009
Biodiversity databases and OGC standards don't play well together
 Some days ago Tim and I had some discussions about how to provide OGC services for biodiversity databases, like for example the Global Registry of Migratory Species. This time the reason for the discussion to start again was the discovery of the new INSPIRE Geoportal Viewer. For those who don't know it, the INSPIRE directive is pushing the creation of a common infrastructure fo sharing geospatial data within Europe. They plan to do that by using Open Standards like the ones from the Open Geospatial Consortium (OGC).
The typical use case they always describe with these Spatial Data Infrastructures (SDIs) is having a registry of services (Catalog Service) where a user can find geospatial data. The data is available through Web services, like Web Map Server (WMS) or Web Feature Service (WFS). With a
web or desktop GIS client you discover, connect to the services, display different layers, do some analysis, print results, etc. All by using open standards and mixing data from lot of different places.
The INSPIRE registry and Geoportal Viewer is the typical example. On the viewer you can select from a list of available services (registered on the catalog service) or use your WMS web service URL.
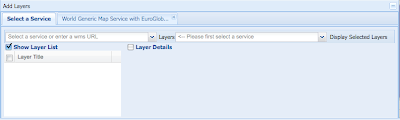
When you select a service, you get a list of available layers on it. For example in the Spanish SDI you get this:
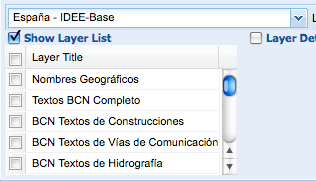
The way this work internally is by doing a getCapabilities request to the WMS server. The returned XML document list the layers available with metadata on how to query it, owner, etc.
But what happens when you have a database like the GBIF cache with 1.8 Million species? You can not create a layer per species, or the getCapabitilites document will be MB and MB impossible to parse by any client. In any case, who wants to provide a list of 1.8M species to select a layer?
Well, the way to make it work is to specify a filter on the WMS request specifying for example the species_id you are interested in. But those generic clients do not support specifying these kind of filters.
To me that means that the current status of OGC clients, like the ones used by INSPIRE, GEOSS, National SDIs, etc. are not able to handle biodiversity OGC services. Or say it in a different way, OGC services are not prepared to handle biodiversity databases with lot of species.
What are the possibilities?
1) OGC supports on their capabilities documents things like "Hey! I am not a service with a set of layers, I am a datastore with potentially millions of layers. So if you want to grab anything from me, you are going to provide a filter in your request". This will imply that OGC do some work and more important, software clients support this work. I think this will not happen in a few years.
2) Create a set of interesting layers in biodiversity. We could match our biodiversity databases against IUCN list of endangered species, create richness maps, etc, but access to primary data per species will not be possible.
If you think on the potential customers we probably should be thinking on a predefined list of layers that we could all create on our OGC services that might be interesting for lot of people. Richness, endangered species, kingdoms, whatever...
Other possibility is that we create portals where the user filter for a species and then gets a "customized,dynamic GetCapabilities document" that will include the filter on the URL. That will be possible. But with Catalog Services, like GEOSS, where there will thousands of services, is biodiversity going to be so special as for the user to go to one of our website before continuing in their wonderful world of web services workflow? I doubt it.
Next week I am going to Geoweb 09 as invited speaker to talk about Biodiversity and the challenges to share it on the Geoweb. I would love to hear what do you think about using OGC services within our community or any other issue related to geospatial data and analysis.
I would love to hear what do you think about using OGC services within our community.
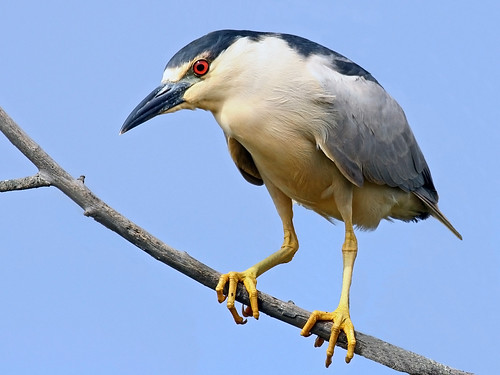
(bird picture by mikebaird)
Thursday, June 25, 2009
RSS feeds used by publishers
One of my current tasks is working on tools to index publications in order to find scientific names. One of the first things to figure out is how to discover publications. Many publishers provide various RSS feeds for their latest issue(s), a feature that uBio RSS is making use of, scanning about 980 journal feeds as of today.
I am trying to put some recommendations together for publishers on how to encode their RSS feeds or to use other formats to make their digital publications discoverable. If you have any recommendations I'd be glad to know about them. Especially on how to best promote back catalogues of all available publications would be interesting, as RSS feeds natively only show the latest ones (there are paging extensions for Atom, but that has no widespread support). Sitemaps or OAI-PMH seem like a good candidate, although something easier than OAI would be preferred.
Wondering which RSS format is most widely used by publishers currently and which extensions they use to encode their metadata, I wrote a little tool today that reads all current feeds known to ubio and checks their rss format, here are the results, not analyzing the namespaces and extension formats yet:
So clearly the rdf based rss 1.0 (often together with Prism) and the simple rss 2.0 format is used mostly.
If there only would be a simple way to page. Maybe Microsofts Simple Sharing Extensions could help?
I am trying to put some recommendations together for publishers on how to encode their RSS feeds or to use other formats to make their digital publications discoverable. If you have any recommendations I'd be glad to know about them. Especially on how to best promote back catalogues of all available publications would be interesting, as RSS feeds natively only show the latest ones (there are paging extensions for Atom, but that has no widespread support). Sitemaps or OAI-PMH seem like a good candidate, although something easier than OAI would be preferred.
Wondering which RSS format is most widely used by publishers currently and which extensions they use to encode their metadata, I wrote a little tool today that reads all current feeds known to ubio and checks their rss format, here are the results, not analyzing the namespaces and extension formats yet:
rss_0.92 = 3
rss_1.0 = 336
rss_2.0 = 431
rss_0.91U = 6
atom_1.0 = 2
So clearly the rdf based rss 1.0 (often together with Prism) and the simple rss 2.0 format is used mostly.
If there only would be a simple way to page. Maybe Microsofts Simple Sharing Extensions could help?
Visualizing Tweeter biodiversity observations
 At Ebiosphere09, there was an Informatics Challenge that Rod Page won, congratulations!
Vizzuality wanted to participate but we did not find the time to work on it. During the conference we found people like @IvyMan twittering observations on biodiversity. This was part of the "The eBiosphere Real-Time Citizen Science Challenge!" which published the rules on how to tweet.
We were far too late to participate on it, but we thought it could be cool to give it a try using the new Flex 4 "Gumbo". @xavijam from Vizzuality was starting to learn Flex 4 so he took this challenge.
We make use of the Twitter API to query for the patterns explained on the challenge rules. Once we get the tweets, parse the latitude and longitude, get the scientific name of the observation and finally present it in a map together with images taken from Flickr.
If you want to make an observation appear on the app just tweet something like:
#eBio observation: #Puma_concolor /-50.412673039931825, -100.713207244873047/ method:iPhonePhotoFlying Puma Concolor
The idea is to mashup the data from Twitter together with the data from Flickr using the Darwin core machine tags. The reason for the second is that we are great supporters of people providing those tags and we created even some stickers to support them.
This is just an exercise to learn Flex 4 and promote the use of microformats and machine tags. But we hope you find it cool.
Some comments. Magically the tweets from @IvyMan on this disappeared while we were developing. Additionally there is not many machine tags in Flickr for the moment on darwin core terms, so there is some fakes over there too.
All the credit goes to @xavijam for working on it! And from his experiments we are learning that is not going to be that easy to migrate to Flex 4.
Monday, June 8, 2009
World Database on Marine Protected Areas new website
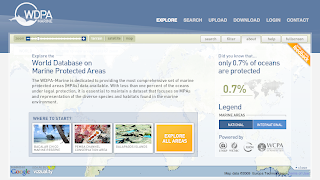
 The UNEP-World Conservation Monitoring Centre (UNEP-WCMC) today unveiled The World Database on Marine Protected Areas - a site designed to provide the most comprehensive set of Marine Protected Areas (MPAs) available.
"With less than one percent of the oceans under legal protection, i
t is essential to maintain a dataset that focuses on MPAs and representation of the diverse species and habitats found in the marine environment." is read on the website.
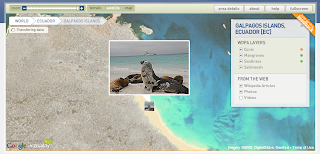
Vizzuality has developed the User Interface and general design of the website, including the logo. Working together with UNEP-WCMC, and specially Craig Mills, we have developed innovative solutions to display this huge amount of data in a hopefully engaging website to invite people explore our oceans.
But enough of "official words", here at biodivertido we would like to explain what are the technologies behind it and how things work under the hood.
Technologies:
The website is a mix between HTML and Flash. The Flash application in the front has been developed using the Flex framework plus some Flash little things. On the ser
ver s
ide there is ASP.NET and WebORB to do AMF remoting.
GIS:
The GIS engine behind the scenes is ESRI ArcGIS Server. WCMC pr
epared the different tiles
and caches for all layers. There is some places where we have used the new ArGIS Server REST API.
On the client side the whole project is very much based on the great Google Maps API for Flash. We want to thank Pamela Fox from Google for her great support of the community. There is several techniques that we have introduced while working on this project like:
- Tile Mouse Over: To change the cursor when hovering over features on tiles.
- WMS overlays: Dynamically changing the Tile Overlays based on zoom levels for cached and not cached tiles.
- Panoramio and Wikipedia markers without proxies.
- Encoded Polilynes for multipolygons with inner rings.
Database:
WCMC is using Microsoft SQL Server 2008 Spatial Database and we worked with them to generated Google Encoded Polylines out of the database.
There are also some things coming from the ESRI spatial database and some stats where dones using it, but I think the general idea is to mo
ve everything to SQL Server.
Deployment:
The whole website is being served from an Amazon EC2 instance. The idea is also to make use of the Amazon Cloud Front CDN to distribute tiles and other static files, but for the moment everything is in EC2.
We will probably post more specific details on different parts of this project in the next weeks, but we wanted to give you a broad overview of how the project works and the different technologies being used.
One more thing...
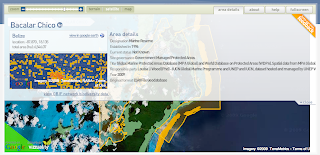
One great thing of working with UNEP-WCMC is that all the source code that we have developed is Open Source! We are still working on specific details on what license the source will get, but for those curious, starting from today you can checkout all source code from Vizzuality SVN repository. Please let us know if you find it interesting!
We are still under Beta phase of the project, so it might be that you find some bugs, please report them!.
Thanks again to UNEP-WCMC to let us work on this great project and look forward to make it better!
Saturday, June 6, 2009
Using Google Spreadsheets with Google Maps for Flash
I have recently been working on a little project that had a very simple purpose: Put in a map around 200 markers about where to find dog waste bags disposals in a town. This might have little intersection with biodiversity, but I think some of the ideas might be useful for other people.
The idea was to create a simple map/widget that could be managed by a non technical person and did not require setting up databases and hosting services. The kind of project you want to set up and forget more or less about it.
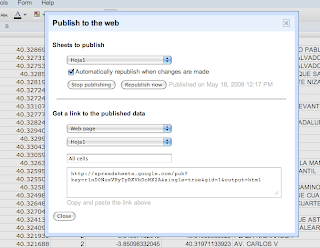
Well, the simplest thing to manage the location of the disposal is something like and spreadsheet and the internet version for that is Google Spreadsheets. I started thinking on using the Spreadsheet mapper, but it has far too much options, and we did not really need to share a KML file. So I thought creating something simpler. Just my required columns on the document and connect from Google Maps for Flash. So we wo
uld be able to just distribute the Flash SWF file and it will take
care of connecting to Google Spreasheets, download the data and display it on the map.
Sounds very easy no? Just publish the spreadsheet, setting automatically republish on changes, select the CSV format, and you get a perfect API to your data. Look at ours for example.
Then on the Flex app is as simple as parsing a CSV and dynamically create the needed markers.
The only problem is... Google does not like crossdomain.xml f
Therefore we were gonna have to create a proxy server to bypass the security restrictions, but we really did not like the idea of havi
ng to set up one just for this small thing and maintaining it.
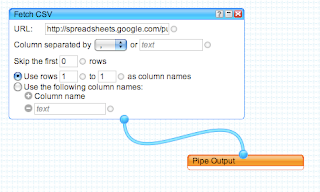
So I decided to take a look at Yahoo Pipes to bypass the crossdomain issue. You just need to create a simple Pipe that consumes the CSV from spreadhseets and output it as JSON. Yahoo pipes has an open crossdomain file, so no problems. Here is my pipe for example. Very simple and effective.
You can see the final result in here. And of course you can always grab the code from Vizzuality Google Code repository.
The project had to deal also with transforming UTMs into Latitude/Longitudes and some other issues, but I think this overview is enough. The source code is so simple that I dont think its needs more explanations.
We would like to start using the Google Data API much more in the future, specially the shiny new Google Maps Data API, but I think this makes for a very simple solutions for lot of small projects like this one.
And finally, Google, please start setting up crossdomain files on your APIs, or at least, explain us why you dont do so... the actual situation is very frustrating.
Thursday, June 4, 2009
Greenpeace BlackPixel | Beautiful Idea
Today we've discovered BlackPixel. A beautiful initiative by greenpeace to save energy.
The application draws a black square in your screen that not disturb your visualization.
If you over the square, you can view how many energy is being saved.
A little effort for you, a big benefit for all.
You can know more about it here
Friday, May 29, 2009
We are going to E-biosphere 09
 E-Biosphere 09 starts next Monday 1st of June on London. Today we want to announce that most of us, Tim Robertson, Sergio Alvarez, Dave Martin and Javier de la Torre, will be there.
 Even more, we have a booth! GBIF & Vizzuality are joining efforts to showcase the recent projects we have been working on and some of the future ones. We are all very excited to showcase what kind of things can be done with biodiversity data and visualizations.
Tim, Sergio and Javier will be present at the booth, but we would like to be present online at the same time. Our idea is to use this blog as the online platform to present the different ideas, prototypes, wireframes, etc that we will showcase at E-biosphere 09. Especially as Andrew could not join us for London. So the blog is our online booth!
In the next few days we will be working hard on different topics, including species distribution, analyses, data integration, indexing, visualisations, taxonomy, data publishing, computing on the cloud, migration paths etc. So stay tuned to know what is going on in multiple posts that we will publish here.
Aditionally you can follow some of us on Twitter:
If you happen to attend e-biosphere please come and join us at the booth, if not we look forward to get your comments on the blog.
See you all in London!
Javier, Tim, Sergio, Dave, Andrew.
A new contributor to Biodivertido
So, I’ve decided to become a blogger. But Javier said that on my quest to riches, I needed to first give a quick introduction. Here you go.
My name is Andrew Hill. I am working on my PhD in Rob Guralnick’s lab in the Ecology and Evolutionary Biology department at the University of Colorado. I began working here almost 3 years ago on a project to reconstruct the evolution and spread of influenza through time and over geography (see here or here). Like the influenza itself, my interests have mutated rapidly. Most of my work now involves at least one of three informatics subtypes; biodiversity informatics, phyloinformatics, or (I’m not sure people say this) visual informatics. I have ongoing research on the evolution of influenza, as well as a handful of smaller genomics and bioinformatics projects, and am just now starting work for the OBIS-USA project.
As for my role at Biodivertido, I don’t know yet. Rob, Walter Jetz, and EOL just put on an excellent workshop in Chicago that gave me, Tim, and Javier the opportunity to talk about our interests and coordinate some of our efforts on a couple of new projects. We will likely be giving you more details about some of those in a few hours. So don’t go far from your RSS feed.
For now, all I can say is that I’m extremely excited to be working with these guys and will hopefully be contributing cool things very soon.
My name is Andrew Hill. I am working on my PhD in Rob Guralnick’s lab in the Ecology and Evolutionary Biology department at the University of Colorado. I began working here almost 3 years ago on a project to reconstruct the evolution and spread of influenza through time and over geography (see here or here). Like the influenza itself, my interests have mutated rapidly. Most of my work now involves at least one of three informatics subtypes; biodiversity informatics, phyloinformatics, or (I’m not sure people say this) visual informatics. I have ongoing research on the evolution of influenza, as well as a handful of smaller genomics and bioinformatics projects, and am just now starting work for the OBIS-USA project.
As for my role at Biodivertido, I don’t know yet. Rob, Walter Jetz, and EOL just put on an excellent workshop in Chicago that gave me, Tim, and Javier the opportunity to talk about our interests and coordinate some of our efforts on a couple of new projects. We will likely be giving you more details about some of those in a few hours. So don’t go far from your RSS feed.
For now, all I can say is that I’m extremely excited to be working with these guys and will hopefully be contributing cool things very soon.
Wednesday, April 29, 2009
GBIF-World Database on Protected Areas project
The GBIF-WDPA project intersects together the data from GBIF and the World Database on Protected Areas. It was developed by Vizzuality for GBIF and IUCN. I have talked about this project in different posts already, but I thought it could be interesting to share an screencast I created some time ago about it.
The video has a little introduction on what was the project about, what technologies were used and finally a demo of the application itself.
Ah! If you want to try the tool for yourself it is finally published. Try it for:
We are working right now on some more advanced visualizations, but this will come hopefully soon. I hope you enjoy it.
Tuesday, April 14, 2009
WMS Tiling Clients
 For projects relying on open source software and using WMS services for their map applications perhaps the most obvious choice for a client application is to write something using the OpenLayers API. This is a very extensive javascript API and is used to demonstrate the open source OGC compliant servers MapServer and GeoServer. Its straight forward to construct a map and then to overlay multiple layers using WMS services.
The screenshot above shows a layer of 0.1 degree cell densities representing data from Australian National Herbarium rendered using GeoServer layered on top of the Google satellite base layer, all pulled together using OpenLayers.
Running this locally the map was rendered by OpenLayers rather quickly. Running this on an externally hosted server I began to notice curious loading of tiles by OpenLayers. So I did a stripped down comparison of the same functionality using the Google maps API. Rendering the cell density tiles from a WMS service in Google maps was done using a javascript function written by John Deck - available here.
The performance improvement with Google maps was immediately obvious. Using the Firefox YSlow plugin we see:
| OpenLayers | Google Maps API |
 |  |
So the performance difference between Google Maps and OpenLayers could be accounted for by any combination of the following:
- Incorrect use of the API (test for OpenLayers is here) and we are missing configuration to reduce tile loading in openlayers
- The tile loading algorithm for Google maps is more efficient in only loading the required tiles for selected view areas
- Openlayers is preloading more images to speed up panning. This would be good, but OpenLayers doesnt seem to prioritise the loading of currently viewed tiles.
Subscribe to:
Posts (Atom)


 Posts
Posts

