Friday, December 19, 2008

Spatial joins using PostGis

In a recent post, Tim talked about reproducing Spatial Joins using Hadoop. The reason why we started investigating on those topics is that we are cross querying the GBIF occurrence database with the Word Database on Protected Areas. The results of this work is already available for Spain, Madagascar and Tanzania. You can also check a particular protected area, like Sierra Norte in Spain. You can expect a following post about the widget developed in Flex and the visualization solution applied there.


In August we started the project only focus on Spain and Madagascar. After extracting the GBIF data that was less than 3 Million records and around 800 protected areas (polygons). With this "little" data I thought I could use some brute force and did not spend much time optimizing the processing of the data on PostGIS. In total it needed around 8 hours to analyze all data and place it in a DB schema that was enough for the service layer of the widget. These scripts are available here.
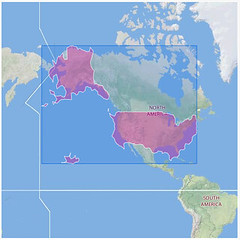
The project was very well received and soon we were asked to extend the analysis to all countries, all protected areas, and all GBIF data. That is around 90.000 protected areas and 130 million occurrences from GBIF. We knew from the beginning that the previous strategy would not scale to handle so much data and that the strategies for data representation would also not work with protected areas of the size of Spain and millions of occurrences inside. So this time we decided to go in two different ways at the same time: Using Hadoop to do the spatial join and adapt the PostGIS strategy to make it more scalable. This post is of course talking about the second strategy.
We wanted to work a little bit generic here and be able to support any kind of "polygon" analysis. That mean we would not be protected areas specific. So we have defined a Starting schema and a target schema databases. The starting schema is how we expect to get the data at the beginning and the target schema is the final processed schema that will be used to serve the data to the widget. GBIF gave us the primary data and WCMC the World Database on Protected Areas. The starting schema looks like:
The data from GBIF was given as a MySQL dump and imported into PostgreSQL using COPY statements. The WDPA on the other hand was given as a huge shapefile that we import using shp2pgsql. 
The main things we needed to process were stats on:
  1. Find which GBIF occurrences are inside which polygons
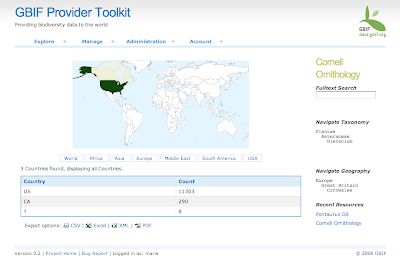
  2. Which providers have data for each polygons
  3. Gridify the occurrences to be able to visualize them dynamically on Google Maps.
  4. Construct a taxonomic tree for each polygon and grid.
So the target schema looks like this (click to expand):
The numbers in red are the number of records on each table after the data was processed.

This is the definition of main tables:

occurrence: A primary data record. The location of a species at a certain place in a certain moment.
site: Even if there are 130M occurrences they are only in around 3.5M distinct points. A site is a point on earth where an occurrence is. This just allows us to geoprocess only the distinct positions and save us lot of time.
grid10,grid5...: The grouping of the sites in cells at different scales, 10, 5,1,0.5 and 0.1 degree. After 0.1 we go dynamically grouping using PostGIS SnaptoGrid (another full post about it would be needed).

The whole processing is done using PostgreSQL and PostGIS with some new functions that we needed to create. The details about the whole process is described here . And the main steps are:

1) Adjust PostgreSQL: use 2GB of RAM. AutoVacuum Off. Use as many processors as possible.

2) Get the sites: No more than a grouping of the occurrences by coordinates.

3) Spatially join the sites with the polygon table: This is where it gets interesting. The fastest way we found was using the distance function and run it threaded in parallel in different parts of the site. This is a  computer intensive task so I used the 8 cores in my computer. The task takes around 4 hours. But depend s a lot on the complexity of the polygons and how good you are at distributing the load among different processors. We used a PHP script and a shell script to run several queries at the same time.

4) Delete sites that are not inside polygons and later delete the occurrences that are not in sites.

5) Create the grids: we are using our own grid system based on work previously done by Tim Robertson. The way we group the sites on the occurrences is by spatially joining the sites against tables with all the grid cells pre-created. To generate the grids Tim developed a little Java tool that create PostGIS insert statements. It is the GridBuilder class .  But if someone needs them we can provide them directly as zip SQL files.

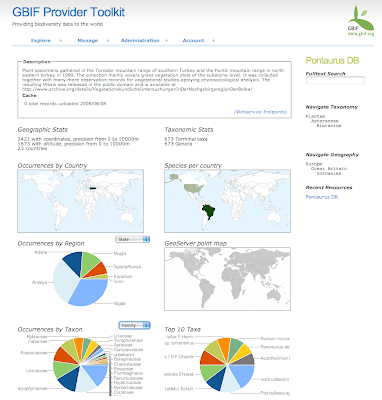
6) Generate stats: Calculate the number of occurrences, species, specimens, observations, other basis of records, plants, animals and other kingdoms. Those stats are available per polygon, per grid, per site, per provider, per taxon, etc... Lot of queries but that run very fast.

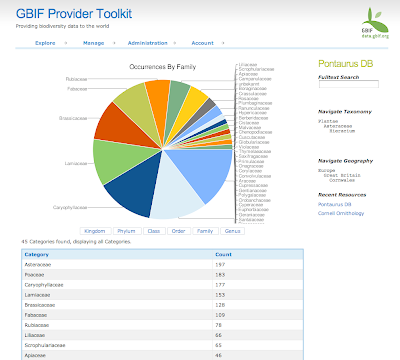
7) Generate taxonomy for each polygon: this can be a complicate process. The idea is to generate classifications per polygon based on the occurrences that are inside these polygons. We have created a PostgreSQL function that scan the occurrence table per polygon and generate the  classification. The source code of this function is here .

And this is more or less everything. Of course lot of details are skipped here, like when to vacuum, generate indexes, etc. But you can find most of these details on the description page of this strategy .

You can find in any case all the source code for all those things on the Google Code GBIF-WDPA project. There you will find the source code of the Java SOA application, the Flex source code of the widget, the processing scripts and comments, well, everything created during this project.
we are working on a single script that will run the full process in one shot and it will be available there when ready.

Summary:
Well, after this long post my main recomendations if you need to use PostGIS to do something similar would be:
-Adjust postgreSQL settings regarding memory.
-Consider threading long operations that require a huge table scan.
-"Create table as" is much faster than updating.
-Amazon Web Services can be very slow due to I/O performance issues.
-Buy a Wii to play while you wait for results :)

Leave us a comment if you have any question or suggestions regarding this processing strategy.

And finally happy christmas everybody!

Sunday, November 30, 2008

Reproducing Spatial Joins using Hadoop and EC2

Finally I got some time to continue researching the use of Hadoop for the processing of the GBIF dataset with respect to the protected areas of the world.

The problem
There is a growing number of point data, and an increasing need to perform cross referencing of the GBIF data with external sources, in this case the protected areas of the world.

The last 3 years of working on reasonably large databases (>100G) has told me that this join was not going to be an easy one, despite the obvious partitioning strategy that can be invoked here (spatial partitioning).
Therefore Javi and I set about this task by
  1. Using PostGIS and the traditional approach of joining 2 tables of 150M point records with 120,000 polygon records - finding will be posted shortly
  2. Using Hadoop and the Amazon EC2 to process the join
Using Hadoop
This is ongoing but I thought I'd post the findings so far.

Strategy 1: 
Partition by cell
Start by splitting the 150M records from one file into a file per 1 degree cell.
Loop over each polygon:
  • Determine 1 degree cells covered polygon
  • Use the input files as a merge input to hadoop and pass in the Polygon for the Map to do the contains()

Result  
Hadoop will not handle so many file splits no matter what configuration I try so far. Mailing list responses suggest this is not the ideal use of Hadoop and it prefers single large files, rather than many smaller ones.

Amendment
Using 10 degree cells, it does work but takes a LONG time... so long I killed it. This was expected since it is really the equivalent of only a DB join with an index on an INTEGER teg_deg column.

Strategy 2: 
1-Degree in-memory index of polygons
So this approach goes through the join the opposite way. The polygons are loaded into memory and a
HashMap<Integer, Collection<Polygon>>
for each Map operation to use.  

The logic is effectively give me polygons intersecting the 1 degree square for this point, and then test them properly. This worked ok, but requires a LOT of memory for the polygons to be held.

Result
About 6 hours to process 60,000 polygons.

Strategy 3: 
RTree index of polygons
Very similar to strategy 2, this approach indexes all the polygons by RTree. Thus for each point, the index provides only candidate polygons whose bounding box contains the point, and the number of candidate polygons to test is far smaller than that of strategy 2.

Result
45 minutes for a 130M x 30,000 cross reference but requires the larger EC2 instance sizes. The RTree index means it will need processed in batches.
Hadoop requires tuning, just like a database does for large joins. Here is the final tuning for strategy 3:
  • mapred.child.java.opts=-Xmx1G // for the R-Tree index
  • mapred.output.compress=false // for easy reading of output
  • mapred.tasktracker.map.tasks.maximum=4 // we have 7G per node, so 4G for 4 Map tasks is ok
  • mapred.job.reuse.jvm.num.tasks=-1 // Reuse the Map as it has the index built (takes 90 seconds for startup)
  • dfs.block.size=134217728 // use larger blocks - in retropsect this was a probable mistake and will be removed for next test
More to follow...

Thanks to the Hadoop-core Users mailing list for their insights, and Andrea of OpenGEO for pointing me at the JTS RTree implementation


Wednesday, November 5, 2008

Do you know any species distribution project?

I am trying to create a general view on how species distributions are handle in different projects world wide. I am specially interested in project where they have maps and are published on Internet. So I would like to ask you for links to projects related to Species Distributions.

I am also interested in different ways people handle occurrence status or absence. 

And finally I also would like links to any mapping application that you have seen related to Species distributions. And if possible comment what you liked.

Please post your links as comments to this post or send them to me (jatorre@gmail.com). I will post in the future the results from this little research.

Thanks!

Saturday, November 1, 2008

Flickr creating polygons out of points, what about species distributions?

This weekend I have found a very interesting post from the Flickr programmers called The shape of Alpha. What this people are basically doing is generating shapefiles from the geotagged pictures in Flickr. When a user geotag a picture, provide lat/long, they reverse-geocode it to find the neighborhood, the town, the country etc where this coordinates are.  They store this information in the database (as  Where On Earth(WOE) IDs) and this allow for much better performance when later people search for pictures in "Madrid".

But this post talks about a different idea, and it is awesome. Now that they have all this geotagged pictures and they know they are in a particular neighborhood or country (WOEID) they are creating shapefiles from these areas based on the coordinates of the different pictures! Maybe is easier to explain it with a picture:

The one in the left is a London polygon and the right for United States. They were created by aggregating all the coordinates of the different pictures found in London and in the US.
Again. They take all the coordinates, POINTs, in the DB for a certain WOEID and with them they generate a polygon. If they have enough data it looks more or less ok. They have a good discussion about the quality of the polygons and the threshold set to generate them. I like very much the introduction they make to  Alpha shapes and the links they provide.
Additionally they also provide the source code of the tool they use to process the data. It is called Clustr.

Now, lets apply this concept to Biodiversity, if you haven't already figure it out. Think of their geotagged pictures as PRIMARY DATA, the WOE as SCIENTIFIC NAMES and the polygons you get out of them as DERIVED SPECIES DISTRIBUTION polygons.
I have been investigating this for a long time already, specially trough the Biodiversity Atlas project that is now stopped, but hopefully will start soon. We can take their source code and apply it to GBIF data and generate "derived, unchecked and uncompleted" species distributions based on GBIF data on a massive way! And the same they try in Flickr, the more primary data we get into the system the better the distributions will start looking like.

But there is another idea... why dont ask Flickr to not only process their polygons based on WOE Ids but also on tags? So if we tag pictures in Flickr with scientific names, or better GUIDs, they can then try to generate by themselves the distributions.

I particularly dont see Flickr as the best place to handle species distributions discussions, and will, hopefully, try to convince at least one big biodiversity project to let me try this way. Most of you can probably imagine the incredible API we can create once we have a lot of species distributions accessible in such a system. I will write another post about it soon, but think of:
  • Which species could live in my garden?
  • Which species habitats this new road will cross? 
  • Where should I create a new Protected Area to preserve as much biodiversity as possible?
  • What species could I find in the track I will hike this weekend?
So maybe instead of so much niche modeling projects we should start thinking on how to manage the vast amount of primary data (and other sources) we have already  and how to curate it and complete it. I dream of a scientific community joined together to create a complete information system to know where species are. Imagine like a Wikipedia but for Species Distributions.


Thursday, October 30, 2008

Word clouds for TDWG 2008

Some days ago I found a great application called Wordle. The application let you generate "word clouds" from text that you provide. It is very similar to what a tag cloud is but with the difference that it analyze the words in a document and not just the tags. The application analyze the frequency of word occurrences.

I gave it a try and I thought it could be interesting for others. For example here is the Word Cloud for the Proceedings of TDWG 2008. Basically I just copied all the text from the PDF and gave it to Wordle for analyzing.


Click on the image to view it in their Java applet.

Then I did the same but with Markus post about TDWG 2008. And here is the result:


They look similar but Markus I think has a higher geek level :D

Finally I could not resist and checked how it would look this blog and here it is:


Seems that the words that use most are Google and Data, even more than biodiversity itself (10 counts for Google and 6 for biodiversity). 

Finally, if you are interested in displaying word clouds in maps there is a recent post for one of my favorites blogs, cartogrammar. I dont see much use on it apart of that they look nice, and they indeed look nice!.


Saturday, October 25, 2008

TDWG 2008 in Fremantle

The great TDWG conference has just finished this year in Fremantle, Western Australia. Me and 180 other biodiversity informatics people have attended and I thought I would point out the most interesting things from my side.

Darwin Core
The most exciting thing to me is the chance to come up with a new Darwin Core soon for ratification that resembles more Dublin Core and consists of possibly 3 namespaces.

While working on the IPT it seemed that most information we are dealing with in biodiversity informatics is centered around 3 entities only: Taxon, Occurrence and SamplingSite. It would make sense in my eyes to separate elements of a new DarwinCore standard according to those core entities. The normative standard will be decoupled from the implementation technology and only consist of natural language definitions with URIs for the elements of the standard. Specific application schemas (called profiles in DC) will then define/recommend how to use DarwinCore within an XML, RDF, XHTML, OGC application schema or tab file environment. Even datatyping can be left to the respective schemas and e.g. dates can be expressed in their native formats. I will give examples of the different representations soon in another blog entry.

Combining these 3 core entities with the notion of one-to-many "extensions", the star schema of the IPT, one can handle quite a rich definition of data. Extensions for multiple identifications can be added to the occurrences, SPM like species descriptions, geographic distribution or species status for invasiveness to the taxon. And still the whole standard and exchanged data can be extremely simple! Btw, simplicity was probably the most mentioned idea in TDWG this year (a really nice talk was about creating a Species Index with SiteMaps by Roger Hyam in our Wild Ideas! session). Controlled vocabularies like BasisOfRecord or Ranks should be expressed in simple ASCII files like the ISO country code one, with a code, label, definition and examples. This also allows for easy translation in different languages because the codes stay the same.

Integrated Publishing Toolkit
Surprisingly many people asked for IPT demos after screenshots were shown in some GBIF talks. Me and Tim did demos nearly every day and the publishing tool was well received in general. Alpha testers (mainly usability) for the public instance at GBIF were gathered and new ideas arose or vague ideas materialised, e.g. validation/annotations:
 * validation can be done through external services that adhere to a simple API. The validaion would be asynchroneous, sending a token, link to the full dataset (either dwc xml or tab file dumps) and a callback handler. Once the validation is done the handler would receive the token and a link to the validation report, an xml file that contains annotations (unstructured text) about records together with some probability and potential suggestions (list) of property changes.
 * provide API to push datasets into the IPT via REST service
 * BCI collection and institution code validation and lookup of GUIDs during mapping.

TAG & GUIDs
Greg Whitbread will likely be leading the Technical Architecture Group. Refining and shrinking the core ontology (owl) was seen as an important issue over the next years.

Originally I had planned to question the uptake of LSIDs again, being in favour of PURLs since the beginning. After long debates that some of us seemed to have experienced before, we came to the following conclusions though keeping up the LSID recommendation:
 * LSID look much more stable in printed publications. That means they should really be resolvable through proper LSID resolution via DSN SRV records
 * LSID are on the agenda of many projects already
 * Proxying LSID with http removes many troubles, especially when used with RDF. The strong recommendation is to always use the proxied version in RDF abouts.
 * Changing the domain used within the LSID might cause problems (e.g. name change of an institutions). It might be better to have a single central LSID authority
 * pure UUIDs with a central resolver would be great. The resolver would have to know about all existing UUIDs in our domain, but it could be mirrored and sharded easily. Maybe something to think about
 * central PURLs and LSID (only) require a registration of services/authorities

Names
Great introductory talks were given by Rich Pyle about zoological and botanical nomenclatural differences and by Nico Cellinese about the phylocode. If you always felt to be on shaky grounds with nomenclature or taxon concepts you should really watch these talks!

Friday, October 24, 2008

Identifying good images on Google cache for scientific names

I have been working on ways to represent taxonomic trees in a more intuitive way for non-biologist. The best I have found until now is to provide a contextual image together with the name. This helps a lot specially on higher ranks where most of the names are very unfamiliar for most of people, like me for example.
The problem is from where to get images about all scientific names. Well the best I managed to find is Google AJAX API. This is the content you get when you search for images on Google. The service is fast and reliable. But, it has one problem, it is not content aware. Well, they are trying, check this and much better this, but still it is not. So sometimes the results you get back just dont make any sense. There are some very pornographic examples of this, but to keep it kids friendly check the Phylum Labyrinthulomycota. The first image you will get is from this nice researcher:
Well, that is not of great help to get an idea of what this phylum is about. Therefore I had been for a while thinking in doing a little application where people can help me to select pictures that actually help to get an idea of what is behind a cold scientific name. And today I had a little bit of time and wanted to deploy something on AppEngine.

So here I am presenting a very simple application to ask for collaboration on this task. There are only 13 million names that I need to find a picture for, but I think I have enough friends :D


The application is very simple and I have not added any visual effects, but I just wanted to give it a try.
The rankings I get from this will be released soon in an API for anybody else.

Things I would like to incorporate:
1) Make it a game, more precisely a GWAP "game with a purpose". Like Google Image Labeler or any other toy from Luis von Ahn. (I wanted to link to his site for sooo much time).

2) Allow Multiple rankings. Now names only get evaluated once so a malicious contributor can ruin all this.

3) More sources, specially Flickr.

4) Nice UI so that Sergio, our new blogger here, is happy :)

When I get a decent amount of reviews from people I will post some stats and an example application.

Come on send the link to everybody and help everybody to understand better scientific names!


Thursday, August 28, 2008

Google Maps HeatMap now correctly reprojected

I posted some weeks ago my first experiment on HeatMaps over Google Maps for Flash. It was well received by the community of google maps developers and several asked for the code. I did not published it ten because there were still some things I did not understand and somehow were just magic and I had to tweak. The biggest problem was that the heatmap actually was not correctly overlaying in the map, it was clearly a Projection problem. I was plotting the coordinates in an image without reprojecting them to the Mercator projection used by google Maps.

Ok, now I have solved this by using the GoogleMapUtility.php class in the server after getting the latitudes and longitudes of my points from the database.

The final result can be viewed here (source view enabled)


This is how the map would look like without reprojection:

And this is how it looks projected:

If you are overlaying a little heatmap over a small area, a city for example, you dont have to worry about reprojecting as there is not much difference. But like in this case, there is no other way.

The projection takes place on the server on this method:

public function getMercatorCoords() {
$conn = pg_connect($this->conn_string);
$query = "select latitude,longitude from my_table";
$result = pg_query($conn, $query);

$dataX = array();
$dataY = array();

while ($row = pg_fetch_row($result)) {
$lat = $row[0];
$lng = $row[1];
$po = GoogleMapUtility::toZoomedPixelCoords($lat,$lng,0);

$dataY[] = $po->y;
$dataX[] = $po->x;
}
$res = array();
$res["dataX"] = $dataX;
$res["dataY"] = $dataY;
return $res;
}
The GoogleMapUtility.php class can be found here. I am not sure who developed it but is widely available all over the web.

In this class I set the Tile Size to be 360, but it could had been more or less anything as long as in the Flex side then you use the same size for creating the Sprite (check the flex source code for more details).

What I would really like is to be able to do this reprojection on Flex as normally I just transfer coordinates to the client and then represent it in different ways, heatmap, grids, markers, etc.
I will try to port the GoogleMapUtility class soon to AS3 and publish it here.

I am using this code already in the widget I am developing for GBIF. It is only a small area and I dont have much data, but I am happy with it.


Wednesday, August 13, 2008

Google Chart API in GBIF Provider Software

Since I came across the Google Chart API I always wanted to try to use it for biodiversity data. And finally I have the chance to. Working on a new provider software for biodiversity data with GBIF, I am using Google Charts to give statistical overviews about the datasets being served.

This is what an overview currently looks like:


A major difference between this software and "classical" wrapper solutions in the biodiversity community, e.g. TapirLink or the BioCASE Provider Software, is to provide an extensible cache database which is specific for biodiversity datatypes. This allows to develop richer user interfaces and webservices and hopefully provide more value to end users, thereby reaching out to more data holders.

Initially the software is planned to work with occurrence/specimen data, taxonomic checklist data and general dataset descriptions using EML files. The software allows you to upload data from databases or files into the cache. Data in the cache can not be modified (other than removing/replacing the entire dataset), so during the upload the data can be analyzed and enhanced. For example UUIDs are assigned if no GUID existed already and records are compared to previously existing records, thereby detecting if a record was modified, deleted or added (information needed for incremental harvesting, e.g. via OAI).  You can read more about the planned functionality on the project wiki (simple bullet points, no proper documentation I am afraid), or in subsequent posts when I will focus on different aspects of the evolving software.

I have been using gchartjava to create the URLs for the google charts, as they can become quite unwieldy if  you deal with more data. But in general it is very nice to work with the API. It is fast enough to answer dynamically generated URLs and the semi-automatic layout works pretty well. Even though this example here, number of specimens grouped by families, contains quite a lot of labels, it works well with an accompanying table.


But the best part of GCharts I think are the country maps. How many times did I want to visualise country based information? With GCharts this is dead easy. You can either assign a specific color to each ISO country (or US state within the US) or assign an integer to each country you want to mark and specify a gradient by defining the color for the max and the min value provided. So in the simplest case you can just pass the number of occurrences for each country. If that number is too large it is better to normalize it before though, because URL strings are limited in length.

Apart from a world map, Google also provides 6 different regional focuses, for example Asia, Europe or the Middle East. So far I am impressed!

Friday, August 8, 2008

GBIF data heat maps - Heat maps over Google Maps for Flash

Maps like everything else seems to be trendy. And nowadays the sexy thing in mapping is the creation of Heat Maps. The best way to understand what they are is to see them:


You can also take a look at this post from one of my favorite blogs on what is and what is not a heat map.
Well for long time I wanted to give it a try and yesterday I had the time to experiment a bit. The idea was to display GBIF available data as a Heat Map over Google Maps. Here you have an screenshot for Quercus ilex:

And if you want to try for yourself here it is (some usability issue, the search box is on the bottom right corner):


So how does it work? It was actually easier than I expected:

1) Get the data: I am using the so called "Density tables" from GBIF. You can access them through GBIF web services API at http://es.mirror.gbif.org/ws/rest/density . For example in a query like this one for Quercus ilex (of course you need to get the taxonconceptkey from a previous request to the services): 

This works fine but has some problems. The first one is that GBIF goes down almost every evening. Tim can maybe explain why. Thats why I am using the spanish mirror (look at the url) and I recommend you to do the same.
Second problem is the verbosity of the XML schema being used. For downloading the Animalia, well thats the biggest concept you can get probably, the result is 14.1 MB of XML. And thats just to get a list of cellIds (if anybody is interested we can post details about CellIds) with counts on them, exactly an array of 34,871 numbers. Even worst is handling them on a web client like this one, parsing such a huge xml output kills the browser. The GBIF webservices API deserve its own blog post I would say together with Tim.

But what is new is that I have supercow powers on GBIF :D I am working for GBIF right now and have access to a test database. In a testing environment I developed a little server app that publish the same density service but using the AMF protocol. I used AMFPHP for this if anybody is interested. There are two good things about using AMF: The output now is around 150 KB for the same thing and AMF is natively supported by Flash so there is no need to be parsed it goes straight into memory as AS3 Objects.

2) Create a Het Map from the data: Once the data is on the client I make use of a Class from Jordi Boggiano called HeatMap.as that creates Sprites as the result. In my case I decided to create a Spring, think like an Image, of 1 pixel per cellId creating a 360x180 pixel image (cellId is equivalent to a 1 degree box).

3) Overlay the image on Google Maps: When you have the Sprite, or even earlier but thats too many details, what you do is overlaying in Google Maps for Flash using a GroundOverlay object that takes care of the reprojection and adapting it to the map. The GroundOverlay is explained in the doc as a way to overlay images but it accepts actually any Sprite.

Done! (almost)

4) Ok, there are some problems: Yes, it is not perfect, these are the pending issues:
  • The GroundOverlay seems to not be reprojecting correctly the Sprite I generate and in the very north and south everything is not correctly overlayed.
  • The resolution of the Heat Map is a little bit poor, bu actually represent the quality of the data we have. Some interpolation could be done to make it look nicer.
  • The colours of the Heat Map do not fit well with the actual Google Maps layers. When there is small data then you can not see it almost.
I still dont feel confident with the code to release it yet. I hope I can work a little bit more on it so that i can be proud, but if you desperately need it let me know.

Just another notice. Yesterday Universal Mind released a preview of a new product: Spatial Key. I am always impressed with what this people does and follow the blogs from their developers (like this one and this one). They are kind of my RIA and web GIS heroes. The new product they have released actually look very much like what I wanted to do in Biodiversity Atlas for data anlysis. It lets people explore geographically and temporally huge datasets. Tim suggested me to contact them and I will do. Nevertheless it is great to have such a great tool available to get ideas on interaction design. Good job Universal Mind, you really rock.

We want to see your comments!

Update: 
Some people asked for different quality settings on the heat map. I have modified the application so that you get now a set of controls to define different quality and drawing options. By default the app tries to figure out depending on the number of occurrences, but maybe thats not the best, depends on how the data is dsitributed. In a final product I think I would NOT provide this functionality to the user, too much for my taste. You know, less is more.

Update 2:
There is a following post with correctly reprojected data and source here.


Thursday, August 7, 2008

WMS Overlays in Google Maps for Flash

While working on BiodiversityAtlas I thought on overlaying distributions using a Geoserver WMS server together with Google Maps for Flash. Well, actually I started working on Umap but then moved to Google Maps. At this moment there were no examples of overlaying WMS with this mapping engines so I worked on it. Now you can find a much better work than mine for Umap here, and in this post I do the same for Google Maps.

Here is the link to the demo with source code view enabled if you just want to see and get the code:

http://biodiversityatlas.com.s3.amazonaws.com/gmapwms/GoogleMapsWMSOverlay.html


Basically it extends Google TileLayerBase and in the loadTile method it generates a WMS Url request converting the x,y,z parameters of tiles to ESPG:900913 . This ESPG has been created to overlay WMS in Google maps so it is aware of the different projections of Google Maps at different zoom levels, so probably you get the best overlay possible.
The trickiest part of the class was converting the x,y,z parameters into coordinates because it involves some reprojection of coordinates that I never really undertood, but that is available from different Javascript Map clients.

Still the support of WMS in Google is quite poor because of the lack of a TileLayerOverlay class on the library. So right now you have to bind your overlay to one maptype and if the user changes it then it disappear. There are hacks to emulate all basic Google MapTypes toegther with the overlay but it is a very poor solution. If you change your MapType you dont want your Overlay to ge trefreshed too. But... hopefully it will be solved soon.

The other missing thing I see is the lack of a method to enforce a redraw of the overlay. In my case the WMS overlay requests include a filter in the URL. My WMS overlay is not static, it is a database of species data, so it only make sense to visualize it with a filter specifying which species you want to see. In the application I let the user choose a species and then I change dynamically the filter in the overlayed class. Of course then I need a refresh of the Overlay but there is no way to do it through the google library. Now I am using a hack as simple as changing 1 pixel the size of the map and therefore enforcing a refresh of the layers on the map. But this is not optimal for several reasons:
  1. Resizing the map is SLOOOOW and the performance is horrible.
  2. When the map refreshed it refreshes all layers, including the ones from google that I dont want to get refreshed, I only want mines to get refreshed! The result is an ugly effect for the user.
Additionally would be great if there is a way to get noticed on when tiles had finished being
loaded for a certain Layer. This would allow to display notifications to the user on when all the
data is ready on the map. In the case of Google Tiles it is pretty obvious for the user when the
data has been loaded. You see the map or not. But in custom TileLayers with little information
on them that overlay over the map, it can be hard for the user to notice if he is seeing all the
data coming from the server.

Hey but I am very happy in general with the Google Maps for Flash API, these guys are doing a great job and Pamela Fox (Google Employee) is very nice on the mailing list solving questions. I just wish Google would spend a little bit more resources so we get new features quicker :)

I still haven't talked about how I solved drawing thousands of polygons efficiently on the map dynamically from user input and lot of curious stuff I am doing for the BiodiversityAtlas Editor. Other thing I am working is on Heat Maps, this should be finished by the end of the week :) Keep tune!

Sunday, August 3, 2008

Nice JSON backed flash charts


There is a nice flash charts implementation, that is backed by JSON calls (here) - ideal for a non flashy, backend java person like me. I plan to use it to produce some summary visualisations on datasets so you can discover what you have before downloading 22Million records or so. Combined with some simple mapping views, I aim to do summaries like (these are just some first thoughts and not properly thought through):

- taxonomic + basis of reference matrix (observations of animals, versus specimens of plants etc)
- temporal coverage by taxa (give an idea of what names might have been used during identification)
- X-referenced with mutliple taxonomies (e.g. Catalogue of Life 2008 covers 50% plants, 75% animals in results)
- occurrence density maps
- taxa "distribution" maps - based on raw points. with BiodiversityAtlas, could overlay real distributions and points
- Protected area coverage (records in protected areas, % of result geospatial scope that is considered protected and which category)

This would all sit on top of data that is mined using hadoop. More to follow as this idea develops...

Friday, July 18, 2008

Visualizing GBIF density data in 3D using Processing

Ok, I recognize it, this is pretty nerdy, but I could not resist. Last week Radiohead released its last video House of Cards and I think it is great. Specially because it is made without cameras and lighting, only "scanners". Basically they just take 3D point positions and then visualize them using software. The making of is pretty cool. And even more cool is that they released the data and the code they used to generate the video (well kind of). They used an open source software called Processing. Basically it is a software to program images, animation and interactions. It is very simple to use and I just loved it from the very beginning. 

So after playing a bit with it and radiohead data I could not resist to create my own experiment. And now that I am playing so much with GBIF density data I thought this could be cool data to represent. I am not sure if it has any potential "real" use but never the less it is lot of fun and maybe a little artistic. The idea is to represent the GBIF density data for Fungi using the count of each cell as the z parameter in the 3D space. This is how the output looks like:


You can download the output also as a native application for:
Or use it as a Java applet at this place. It does not work in my computer but you know Java applets, they never work as intended ;)

The source code used to generate this program looks like:

import processing.xml.*;
import processing.opengl.*;

XMLElement xml;

ArrayList points = new ArrayList();

int maxCount = 0;

int currentX;
int currentY;

int frameCounter =1;

void setup() {
size(1024,768, OPENGL);

frameRate(24);

//Draw lines at a width of 1, for now.
strokeWeight(1);

xml = new XMLElement(this, "http://es.mirror.gbif.org/ws/rest/density/list?taxonconceptkey=13140807");
XMLElement[] densityRecords = xml.getChildren()[1].getChildren();
int numSites = densityRecords.length;
for (int i = 0; i < densityrecord =" densityRecords[i].getChildren();" coord =" new"> maxCount) {
maxCount = int(densityRecord[4].getContent());
}
points.add(coord);
}
}
void draw() {

// Lets adjust our center slightly
translate(-500,-400);
// Lets draw things bigger
scale(2);

// We'll use a black background
background(0);
// The data has 0,0,0 at the center and we want to draw that point at the center of our screen
translate(width/2, height/2);

rotateX((mouseY+512)/150.0);
rotateY((mouseX+384)/150.0);

for(int i=0; i1000) {
z= z/10;
}

z = (z*10000)/maxCount;

stroke(z*3.9,z*3.9,200,255);
line(x,y,z,x+1,y+1,z+1);
// println(x+"-"+y+"-"+z);

frameCounter++;
//This is used to save frames to create a video for Youtube
//saveFrame("renderedFrames/"+frameCounter+".tga");
}
}
Lot of things could be improved to make it more interesting, but that was nerdy enough. I have not been available to work much lately due to weddings, climbing mountains, birthdays, etc. Hopefully you will see some more things coming from my side soon.


Monday, July 7, 2008

Cascading Hadoop

When running MapReduce stuff, it very quickly becomes apparent that simple jobs need queued up then an operation run on the output of another, or perhaps an operation run on multiple outputs from another - almost like a cascaded effect one could say... Enter Cascading, a project that aims to build fault tolerant workflows on top of Hadoop.

I have only just started to play with it (similar to Hadoop it is not in the public maven repositories, so of course I wrote my own pom to do a local install). It is a new project and a small team (1 guy?) but it looks promising, although I think it misses a few more getting started examples for common operations - but I figure if people blog about it like here, the examples will pop up pretty quickly.

One of the nice features that immediately attracted me to it was the fact that it can do visualisations of the workflow for you like so (this is just an example workflow, not the code below):


And here is the example. I am using my standard subset of GBIF data, and grouping together the records by scientific name and then sorting them on resource and basisOfRecord (some databases can't mix group by and order by in SQL without temp table creation, so this seemed like a nice example).


public void run(String input, String output) {
// source is the input file - here I read from local file system
// (e.g. not the distributed fs)
Tap source = new Lfs( new TextLine(), input );

// sink is the output file - here I write to local file system
// (e.g. not the distributed fs)
Tap sink = new Lfs( new TextLine(), output, true );

// my tab file schema
Fields dwcFields = new Fields( "resource", "kingdom", "phylum", "class", "order", "family",
"genus", "scientificName", "basisOfRecord", "latitude", "longitude" );

// parse the data
Pipe pipe = new Each( "parser", new Fields( "line" ), new RegexSplitter(dwcFields));

// define some group and sort fields
Fields groupFields = new Fields("scientificName");
Fields sortFields = new Fields("resource", "basisOfRecord");

// a group by with a sort...
// note that this takes the previous pipe
pipe = new GroupBy(pipe, groupFields, sortFields);

// connect the assembly to the SOURCE and SINK taps
Flow parsedLogFlow = new FlowConnector().connect( source, sink, pipe );

// start execution of the flow (either locally or on the cluster)
parsedLogFlow.start();

// block until the flow completes
parsedLogFlow.complete();
}


So this was very simple, and it was only the first night playing. Note that this code does not have a mention of a MapReduce job, or anything more complex than a simple tap, pipe, sink workflow,,,

I will proceed by trying to do a much more complex workflow - I think splitting the world data into the 2.8 grids I proposed earlier (6 zoom levels), followed by doing some breakdowns for various analytics I anticipate producing. Then I will report back with metrics running from EC2.
What I would really like to do, is have some nice metadata that accompanies the datafiles at each process that gives the semantics of the file - e.g. something that describes the columns in the tab file, so I expect to use the TDWG vocabularies and do some RDF (perhaps RDF represented as JSON?) This way I can set up the Fields automatically, based on the content of the file, and accept different input formats.

Tuesday, July 1, 2008

BADE (Biodiversity Atlas Distribution Editor) introduction

I have been working hard in the last weeks in the Biodiversity Atlas editor. Most of the time I spent it in figuring out realistic ways to use Google Maps API with Biodiversity data. As Tim always say, we have to move from points, so here we are with Polygons! The problem is that polygons do not perform that well in web mapping interface. I end it up trying Yahoo Maps for Flash, UMap and finally Google Maps for flash. I think Google has the fastest API and I figured out more or less how to not kill the client and have a responsive interface according to the actual RIA days. Of course the technology that I am using is Flex. One of these days I have to do a post just talking what I love Flex so much, but just to justify myself I really think is the only option right now to do this semi gis applications on the web. With Flex I can handle 10 or 20 more polygons than with Javascript and I definitely feel more productive.

In any case. What is BADE? Well this project started as a subproject from Biodiversity Atlas and ended it as a stand alone project. The idea at the beginning was to create a small module for users to be able to contribute with distributions directly from the web. And I started investigating ways to let the people create distributions. With all the problems with performance I had to think a lot about data models and ways the application would be able to handle lot of data and geometries at the same time. Specially hard was the creation of grids and handling different scales or precessions, so hard that right now we sticked to 1 degree cells and look for future developments. In any case, once I had a good data model and a feasible way to draw on the map lot of data I thought this was a good start for a small application for doing Analysis! So there I focused. What are the main ideas behind:
  1. Be able to "draw" the distributions of species on a grid system.
  2. Be able to import other sources of data, like GBIF, to complete your data or to just use external data
  3. Import from CSV and Shapefiles and export to everything we can.
  4. Engage users to share their work, but not force them, in Biodiversity Atlas to create a coherent and comprehensive source of distribution data.
  5. Let people work collaboratively online like Google docs let you do or all these new incredible web 2.0 apps out there.
  6. Continuos addition of analysis tools that work out of the box with your existing data.
Most of the points are still not covered, but I wanted to release early and ask for feedback as soon as possible. What can the app do right now?
  1. Create and edit datasets.
  2. "Draw" occurrences
  3. Import data from GBIF
  4. Save the document and reload it.
Not much, but the core is already there and right now adding functionalities should be easy and fast.

So here you can see some screenshots and more important you can try the application for yourself! Please I want to hear your feedback!


Sunday, June 29, 2008

Hadoop on Amazon EC2 to generate Species by Cell Index

I finally took the plunge onto the Amazon Elastic Cloud to do some proper distributed processing using Hadoop after spending the past few weeks playing with MapReduce and distributed processing.

This is a post about my experiences and lessons, but for those who just want the result:

Macbook Pro, 2G JVM, 1 node Hadoop, species per 1 degree cell for all GBIF occurrences: 2449 secs
EC2 20 small instances, species per 1 degree cell for all GBIF occurrences: 472 secs

And the details:

This experiment was to simply generate the Species per Cell (1 degree x 1 degree) index for the entire GBIF occurrence record store (135M record index used) and run some comparisons for local versus cloud execution.

So the code (About 20 lines of 'real' code and maybe it could be optimised further - the reduce for example):

/**
* Generates the species by cell index
* @author timrobertson
*/
public class SpeciesByCell extends MapReduceBase
implements Mapper,
Reducer {

// assuming this is a large object as they reuse it in the tutorials...
private final static IntWritable cellId = new IntWritable();
private Text speciesMap = new Text();
private Text speciesReduce = new Text();

// reuse the pattern for performance
private Pattern tabPattern = Pattern.compile("\t");

/**
* Outputs Cell:Species
*/
public void map(LongWritable key, Text value,
OutputCollector output, Reporter reporter) {
String data = value.toString();
if (data != null) {

// sci name is column 2, lat 11, long 12
// split is not the best way to split a string
String parts[] = tabPattern.split(data);
if (parts.length>= 12) {
try {
cellId.set(SpeciesByCell.toCellId(Float.parseFloat(parts[10]), Float.parseFloat(parts[11])));
speciesMap.set(parts[1]);
output.collect(cellId, speciesMap);
} catch (NumberFormatException e) {
} catch (UnableToGenerateCellIdException e) {
} catch (IOException e) {
}
}
}
}

/**
* Distincts the species
*/
public void reduce(IntWritable key, Iterator values,
OutputCollector output, Reporter reported) throws IOException {
Set species = new HashSet();
while (values.hasNext()) {
species.add(values.next().toString());
}
for (String s : species) {
speciesReduce.set(s);
output.collect(key, speciesReduce);
}

}

/**
* Gives a cell id
*/
public static int toCellId(Float latitude, Float longitude) throws UnableToGenerateCellIdException {
if (latitude== null
|| latitude < -90 || latitude > 90
|| longitude < -180 || longitude > 180) {
throw new UnableToGenerateCellIdException("Latitude["+ latitude+"], Longitude["+longitude+"] cannot be " +
"converted to a cell id");
} else {
int la = new Double(Math.floor(latitude + 90)).intValue();
int lo = new Double(Math.floor(longitude + 180)).intValue();
int cellId = (la * 360) + lo;
return cellId;
}
}
}


Hadoop says it supports GZip files - so I GZipped the input data, which is simply 13 columns of DwC. Unzipped, the data is 13G, gzipped 972M.
Following uploading and running however, I found some pretty unusual results. Falling back to my favourite invasive (Passer domesticus) to run a smaller test I found that on GZipped the map worked on 246,768 rows, not the full 900,000+. Therefore, I conclude that I am either not running it right, or it does not support GZipped input. I don't see how the distributed chunking could work if it is GZipped, and looking through the docs I think it is only on the output that you can use GZip. So, I then started again, and extracted the full 13G and got that on the HDFS for processing.

Now, since I am a maven user, I need to build up an executable jar; here is the pom section that sets the manifest:

<build>
<defaultGoal>package</defaultGoal>
<plugins>
<plugin>
<groupId>org.apache.maven.plugins</groupId>
<artifactId>maven-jar-plugin</artifactId>
<configuration>
<archive>
<manifest>
<mainClass>com.ibiodiversity.index.mapreduce.SpeciesByCell</mainClass>
<packageName>com.ibiodiversity.index.mapreduce</packageName>
</manifest>
</archive>
</configuration>
</plugin>
</plugins>
</build>


Now, we put the input file onto S3 for use in EC2:
bin/hadoop fs -put /path/to/source s3://<id>:<secret>@<bucket>/path/to/target

(Ok, do NOT do s3://<id>:<secret>@<bucket>/ - it blew up when I tried to move the file out of S3 onto a local HDFS since it was in the root. My second attempt (of 2 hours transfer) was to ibiodiversity-gbif-dwc/dwc/allData)

Of course, my has a / in it, so the Hadoop client blows up even when they are escaped as %2f... in the end I got the hadoop code into eclipse and hacked it directly.

Uploading to S3 using the hadoop FSShell take a LONG time from my house! 3 minutes per 32meg = 186kb/s
Now that it is on S3, I can run many index generations without this latency, but each time there is a version, it would need updated. Clearly it will be better to harvest straight to S3 (perhaps in pages?).

1.5 hours (of hoping the network stays alive) later... (make that 3.5 hours total waiting time, but it is there for next time)

Now I fire up a master instance (standard Hadoop 0.17.0 AMI), connect to it, and copy across the input data using:
cd /usr/local/hadoop-0.17.0
bin/hadoop fs -mkdir logs
bin/hadoop distcp s3://:@/path/to/logs logs


The dreaded / problem again!!!
This time no way to easily hack around it, so top tip: keep reproducing your secret key until it has no /_- characters in it!!!
Now the copy works fine.

Copy up my jar file to the master (run locally)
. bin/hadoop-ec2-env.sh
scp $SSH_OPTS /tmp/speciesByCell.jar root@$MASTER_HOST_DNS:


So, as always we need a benchmark from single node.
Macbook Pro 2.4G, 2G JVM Memory:

org.apache.hadoop.mapred.Counters Counters: 11
org.apache.hadoop.mapred.Counters Map-Reduce Framework
org.apache.hadoop.mapred.Counters Map input records=134475707
org.apache.hadoop.mapred.Counters Map output records=106297454
org.apache.hadoop.mapred.Counters Map input bytes=14209537679
org.apache.hadoop.mapred.Counters Map output bytes=2406590553
org.apache.hadoop.mapred.Counters Combine input records=106297454
org.apache.hadoop.mapred.Counters Combine output records=1130567
org.apache.hadoop.mapred.Counters Reduce input groups=41845
org.apache.hadoop.mapred.Counters Reduce input records=9565669
org.apache.hadoop.mapred.Counters Reduce output records=7259291
org.apache.hadoop.mapred.Counters File Systems
org.apache.hadoop.mapred.Counters Local bytes read=3038621493011
org.apache.hadoop.mapred.Counters Local bytes written=73325771174

Finished in 2449 secs!

And 20 Node cluster:

08/06/29 17:31:04 INFO mapred.JobClient: Counters: 17
08/06/29 17:31:04 INFO mapred.JobClient: File Systems
08/06/29 17:31:04 INFO mapred.JobClient: Local bytes read=298092555
08/06/29 17:31:04 INFO mapred.JobClient: Local bytes written=597267841
08/06/29 17:31:04 INFO mapred.JobClient: HDFS bytes read=14210393954
08/06/29 17:31:04 INFO mapred.JobClient: HDFS bytes written=53736532
08/06/29 17:31:04 INFO mapred.JobClient: Job Counters
08/06/29 17:31:04 INFO mapred.JobClient: Launched map tasks=231
08/06/29 17:31:04 INFO mapred.JobClient: Launched reduce tasks=1
08/06/29 17:31:04 INFO mapred.JobClient: Data-local map tasks=207
08/06/29 17:31:04 INFO mapred.JobClient: Rack-local map tasks=5
08/06/29 17:31:04 INFO mapred.JobClient: Map-Reduce Framework
08/06/29 17:31:04 INFO mapred.JobClient: Map input records=134475707
08/06/29 17:31:04 INFO mapred.JobClient: Map output records=106297454
08/06/29 17:31:04 INFO mapred.JobClient: Map input bytes=14209537679
08/06/29 17:31:04 INFO mapred.JobClient: Map output bytes=2406590553
08/06/29 17:31:04 INFO mapred.JobClient: Combine input records=104849073
08/06/29 17:31:04 INFO mapred.JobClient: Combine output records=780651
08/06/29 17:31:04 INFO mapred.JobClient: Reduce input groups=41845
08/06/29 17:31:04 INFO mapred.JobClient: Reduce input records=9416965
08/06/29 17:31:04 INFO mapred.JobClient: Reduce output records=7259291

Finished in 472 secs!


None of these were tuned in anyway (Mappers, Reducers, Block Size etc)

Cost of running: well, less than 1 hour so ~$2 (20 x $0.1 + a little for transfers)

(Thanks to Tom White for publishing guidelines on Hadoop on EC2 here on which I based this test.)


Wednesday, June 25, 2008

Convex Hull over GBIF "points"

I found yesterday a post where Convex Hull was explained and the source code made available for Javascript and PHP. "The convex hull may be easily visualized by imagining an elastic band stretched open to encompass the given points; when released, it will assume the shape of the required convex hull." (from wikipedia). I talked about it months ago with Tim and I thought that would be fun to adapt it to AS3 and use it in BiodiversityAtlas. Months ago we talked that one way to create "polygons" from gbif straight points was to do a Convex Hull over them.
But when finished I realized it might dont make much sense... the convex hull over GBIF points always display enormous polygons over land and water that dont look very nice. Look at the next picture.
This is Puma concolor convex hull over GBIF data. Well this is exactly what a convex Hull is so I am not sure what I was expecting.

There is other types of convex hull like the Orthogonal convex hull that might make more sense in some scenarios, but in general this does not look good to me.

By the way, the convex hull algorithm i am using, quickhull, is amazingly fast.

If you want to try for yourself I have uploaded the test app for you to try. If anybody is interested in the source code let me know and I will post it.

Sunday, June 22, 2008

Mapreduce for species in a Protected Area

The World Commission on Protected Areas (WCPA) publish shapefiles for protected areas, so I thought I'd run these against the GBIF index and get some species lists.
Since I was running on the full 135 million record GBIF index, and the IUCN Categories I-VI National shapefiles containing 60,753 polygons, I went back to Hadoop running in single node mode (i.e. the simplest of simple) as I am not sure the Mapreduce 'Lite' I wrote would cut it.

Input file: 135 Million records of 12 DwC fields (13G)
Stack: Hadoop for Mapreduce, Geotools for Polygon

I went for the brut force approach; the Map held a List<Polygon> and I looped each time over the polygons for each GBIF point record (60,000 x 135M = 8,100,000,000,000 comparisons ;o)

Of course this did not perform... but I wanted to post some benchmarks:

Reference: A Map that does nothing, and the GBIF index input: 500secs
Per Polygon: 1500secs to produce the species by polygon
(Note: This is running Mapreduce in a non clustered, single server environment)

I tried this using the polygon bounding boxes only, to remove Geotools from the equation in each Map operation and the results were the same.

It is clear that to do this kind of processing, the data needs to be sliced up to reduce the number of combinations.
I am pondering using the same tiling algorithm that the map guys seem to have settled upon (e.g. GE superoverlay style). By doing this, a preselect based on the intersect of the protected area bounding box with the tiled data would result in massively reduced processing. I am thinking 7 zoom levels resulting in 32768 distinct tiles so therefore working only on 2.8x2.8 degree cells. Currently GBIF models to 1x1 degree and 0.1x0.1 degree cell but this does not easily port to Mapreduce for partitioning purposes of the input data.
(As a side effect, the tiles could be processed in parallel for specific mapping views ready for immediate serving through Geoserver...)

Tuesday, June 17, 2008

Displaying Shapefiles in Google Maps for Flash (or any other AS3 mapping engine)

Recently I have been exploring different ways to let the user upload Shapefiles to a flex application and display it on Google Maps for flash or Umap. I am working on this for BiodiversityAtlas where users will be able to upload species distributions in SHP.

There are two easy options you can try:

1) Load the Shapefile natively in Flex using vanrijkom classes. Read the geometries and create overlays for the mapping api.
2) Process them in PHP using the ShapeFile.inc.php class developed by Juan Carlos Ulloa, send them, using AMFPHP,  as AS3 objects using similar to the mapping API and overlay.

I have tried both ways now. You can check the code of the first try and a demo at:

http://biodiversityatlas.com.s3.amazonaws.com/shps/shapeFileReader.html

I am still not sure which way I am gonna take for BiodiversityAtlas as both look fine to me. I probably will use the PHP way as in any case, if the user has to upload the file to the server then I can process i there anyway and I might store them directly on PostGIS even before displaying... so that looks my router.

But in any case is great to see I can go both ways and that both are surprising fast.

If anybody is interested on the PHP example please let me know. 

Sunday, June 15, 2008

Generic data harvester

Work is underway on a generic harvester for biodiversity data sources (DiGIR, TAPIR, BioCASe, OAI-PMH + others when they come up - LSID + TaxonOccurrence etc).

The goals of this project are to remove the need for application developers to spend time on data harvesting, scheduling of harvesting, console for log display or basic processing.  The framework is extensible, with each protocol residing in a very simple subproject (new protocols / versions easy to add) and UI generated automatically for parameter input (no need to write JSP for a new protocol!!!).  Everything is internationalised, including all logs which come with a simple JSON+AJAX based log tailing in the browser.  If we can work with the wrapper providers, and offer a single generic solution to TDWG, perhaps we should be aiming to get to the stage where data providers are certified to work with the TDWG harvester?

The code is almost stable, and ready to accept contributers (Java developers)...

(Built on top of AppFuse, Java, Spring, Hibernate, Struts2, Maven, Mysql soon to be H2)

MapReduce 'Lite'

I have been playing recently with the Hadoop distributed filesystem which ships with a MapReduce framework for processing large volumes of 'point' style biodiversity data.  The results were reasonably promising, but Hadoop is designed to process LARGE quantities of data (terrabytes) and not the mediocre few 100G that I am processing.  Futhermore, Hadoop is designed to be run on multiple machines and not the 'dual node on one machine' that I was running.  The MapReduce idea however really does fit the bill nicely for what I want to process, and therefore I went looking for a MapReduce 'lite' in Java but alas, it seems only geared for enterprise development.  So I started coding...

Inside iBiodiversity you will find a simple MapReduce implementation in Java.  Working on 11 million point occurrence records, my implementation generates the species per 1x1 degree cell index.  This is necessary to efficiently allow UI offering a clickable Map that pulls up the distinct species the system has data for.  Tuning parameter wise, you can configure the size of the pages to be worked on (P) and the in memory sort size (M) before a temporary file is written.  I found P:M of 10:1 was producing the best results, with the processing 11M records taking 175s with only 256M of process memory.  

This looks fairly promising as a means of quickly writing code that can run in parallel manner to process data into a format for custom views of biodiversity data (Species by cell, cells by species, cells by month by species, species by cell by decade, species interaction at the same time / place, aggregate counts etc etc).  If it can work on my MapRecuce 'Lite' then we know as data grows it will port to Hadoop easily.  

What next?  It will go into some index (H2, SOLR, Compass looking likely candidates and all semi tested already in iBiodiversity) with a service on top for Javi to do some UI magic

Thursday, June 12, 2008

Using Google Charts with GBIF stats data

While developing the Iphone UI I wanted to give a try to the Google Charts API. This is a pretty amazing powerful API to create easily charts. The charts always come back as simple images so no chance to create interactive stats like with Flash and specially Flex Charting. In any case this is so simple to use that I had to give it a try.

But lets take a look at one example. You want to have a world map with different colors per country depending on how much occurrences there are in GBIF database for a certain taxon, uff!. For example Pinales:


Well it is pretty simple, the URL looks like this:

http://chart.apis.google.com/chart?cht=t&chs=300x163&chco=ffffff,edf0d4,13390a&chtm=world&chf=bg,s,EAF7FE&chld=
GBDEUSNOFRCZPLSEATAUESIEPGMXNLKRCACHBELUNZITNCIMILIDPSJOFILIJPRUD
KSICRGRSYPEVNTWPTHNCNNIBOMGECHUGIARGTSKPYSVVEKPTZCOPAMABYTRDOM
MBRLABZEGCLLBZAGEKEMYHTADAMINPHLTSBPRUGVAKZTHMKGLUZUABGGFCDPK
ALETTJHRCMKGAQSZNFRSZMBILYGYMCSMIRLSCYROAZEEVUMZDZISNGMWSAZWLV
GANPLKKHTCBTMN&chd=s:6aZTNMLLGEDDCCCCCBBBBBBBBBBAAAAAAAAAAAAAAAA
AAAAAAAAAAAAAAAAAAAAAAAAAAAAAAAAAAAAAAAAAAAAAAAAAAAAAAAAAAAAA
AAAAAAAAAAAAAAAAAAAAAAAAAAAA

Well it looks complicate at first look but this is just because of the encoding of the data to represent. Step by step is easier, this how it was done:

1) Connect to the GBIF API service to retrieve occurrences per taxon and per country:

2) Generate the URL for charting:

$churl = "http://chart.apis.google.com/chart?cht=t&chs=300x163&chco=ffffff,edf0d4,13390a&chtm=world&chf=bg,s,EAF7FE";
$country_list="";
$country_data="";
foreach($json['Resultset']['Result'] as $country) {
$country_list.=$country['id'];
$country_data.=$country['count'].",";
}
$country_data = substr($country_data,0,strlen($country_data)-1);
$churl .= "&chld=".$country_list;
$churl .= google_chart_encode($country_data,"s");


Thats it! You got the URL. this was done in PHP but it could had even been done in Javascript

I also used it to represent the amount of data per country currently avaialble in GBIF. If anybody is interested please let me know and I will provide the code.