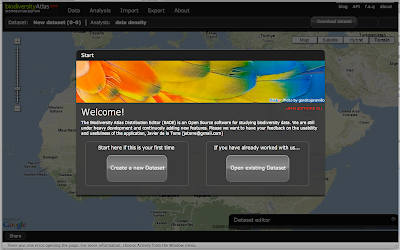
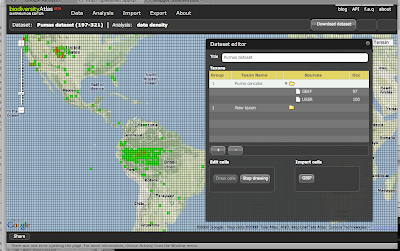
In any case. What is BADE? Well this project started as a subproject from Biodiversity Atlas and ended it as a stand alone project. The idea at the beginning was to create a small module for users to be able to contribute with distributions directly from the web. And I started investigating ways to let the people create distributions. With all the problems with performance I had to think a lot about data models and ways the application would be able to handle lot of data and geometries at the same time. Specially hard was the creation of grids and handling different scales or precessions, so hard that right now we sticked to 1 degree cells and look for future developments. In any case, once I had a good data model and a feasible way to draw on the map lot of data I thought this was a good start for a small application for doing Analysis! So there I focused. What are the main ideas behind:
- Be able to "draw" the distributions of species on a grid system.
- Be able to import other sources of data, like GBIF, to complete your data or to just use external data
- Import from CSV and Shapefiles and export to everything we can.
- Engage users to share their work, but not force them, in Biodiversity Atlas to create a coherent and comprehensive source of distribution data.
- Let people work collaboratively online like Google docs let you do or all these new incredible web 2.0 apps out there.
- Continuos addition of analysis tools that work out of the box with your existing data.
- Create and edit datasets.
- "Draw" occurrences
- Import data from GBIF
- Save the document and reload it.
So here you can see some screenshots and more important you can try the application for yourself! Please I want to hear your feedback!


2 comments:
Hey Javi
This is really nice!
I still don't get why a dataset is multiple taxa though... Can you put some thoughts up as to the thinking behind that?
Long term wise, will you be able to have multiple layers within a taxon (e.g. create a masking layer for bad GBIF points, import from UserX, import from another source, draw a layer etc).
Maybe where you have taxon name, I just expected it to be layer name and the dataset is for a taxon?
I'm not saying I disagree with it, just curious for the thinking behind it.
Cheers,
Tim
hola Javi,
nice work! very impressive the grid drawing and GBIF connection; i'm really curious to see the future developments; it looks promising.
congratulations,
Pere
Post a Comment