In todays world the easiest way to share location is using Decimal latitude and longitudes, and preferably on WGS84. With such coordinates you can make use of lot of existing data transfer standards, mapping APIs, or analysis tools. This is good because it helps a lot on interoperability and let developers and scientist easily mix data and use it together.
But, most of biodiversity primary data, the location of a species at a certain place in a certain moment, was taken before GPS and even after lot of different coordinate systems were used. For example UTM. In those coordinates systems people do not indicate an exact position, like you do with lat/lon, but an area or zone. That is ok for most uses, you dont need to know the exact position of where a specimen was collected, and sometimes it is even much easier to use those zones, or cells or area, to collect and aggregate data.
The problem comes when you start sharing your data in public networks like GBIF. Most of data providers in the GBIF network, if not all, provide their data using lat/long. This is even the recommended method to easier process and aggregate the data. Therefore what most providers are doing is transforming those areas into points by taking the centre of the area.
If you put this transformed coordinates with other real lat/long coordinates, like GBIF does, then you end up not knowing what was originally a cell or an area and what was really a point.
This shows the result when represented in a map (click to see it bigger). Or better use this application to browse the data for yourself (development server).
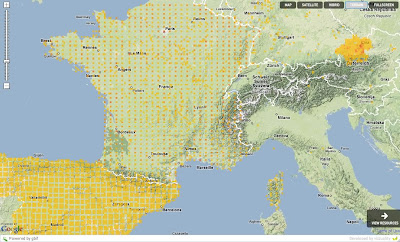
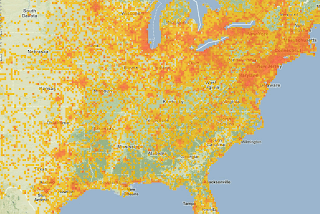
This is all the data GBIF has from different data providers about Passer domesticus (House sparrow). You can see that Spain, France and Austria seem to have some weird data. They look like if the a gridified. Specially if you compare it to the US:
The reason is that most of the data in Spain, France and Austria (also Germany but is not shown here) is derived from UTM data or another form of "area" coordinates.
And the worst is that we can not know which data is actually grid data and what is actual points, we can only see it on a map like this.
This has some repercussions:
Errors:
We are introducing errors to the data. The user do not know the "resolution" or quality of the data coming from GBIF. For example in France, the data in GBIF says that there is a Passer domesticus at the red point, when actually it could be in any of the greed square. Thats 25Km error from one side to the other
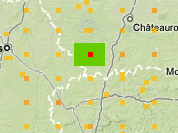
In Spain the error is around 10Km and in Austria is around 900m.
Visualization:
Without knowing what is a point a what is an area, it is very complicate to do any visualization that does not look strange in some areas. Experience users will understand why it might be like this, but most of the users will not. And people will keep zooming into a point thinking they can get to see the exact position of where a species was observed or collected, when actually this point is not real at all, it is just a visualization error due to the underlaying data problem.
Of course there is some works around. People are starting to share their coordinates with an error indicator. Thats good, but this is not an actual error from my point of view, it is just a different way of collecting locations, the error is in thinking that this is actually a point, when it is not, it is an area.
Fitness for analytical use:
Consider modeling predictive species distribution based on known (point) occurrence data for areas having similar environmental conditions (Environment Niche Modeling). The results of any model would be wildly inaccurate considering a 25Km deviation of input data. Some indication is necessary so that data rounded to the nearest grid is not considered valid for this use.
Possible solutions:
What possibilities we have? Well, I think the best would be to let the user share their data in the way they have it. Of course you can do that already in comments and things like that, but thats not very convenient.
So I think the best is that if people has location based on UTMs they share them like they are and also the Spatial Reference System as Well Know Text. So for example UTM10N would be:
PROJCS["NAD_1983_UTM_Zone_10N",and then they will have to share the easting and northing, like 630084m east, 4833438m north.
GEOGCS["GCS_North_American_1983",
DATUM["D_North_American_1983",SPHEROID["GRS_1980",6378137,298.257222101]],
PRIMEM["Greenwich",0],UNIT["Degree",0.0174532925199433]],
PROJECTION["Transverse_Mercator"],PARAMETER["False_Easting",500000.0],
PARAMETER["False_Northing",0.0],PARAMETER["Central_Meridian",-123.0],
PARAMETER["Scale_Factor",0.9996],PARAMETER["Latitude_of_Origin",0.0],
UNIT["Meter",1.0]]
With this information the end user can then decide if they want to transform into lat/long if necessary, but at least they know what they are doing.
Additionally, indications that records have been rounded to a grid are required to determine their fitness for use.
I dont have experience using UTMs so I might be wrong on some of the things I have said, but at least I hope you get an idea on what the issue is and why I think is important to work on it.
Update: I should have mention that the ABCD TDWG Standard actually supports more or less what I said by providing atomic concepts for sharing UTM data. These are:
I was part of the ABCD authors but at this time never looked much into the geospatial part of it. Now it looks to me that this is the case for a correct use of the "variable atomization" method that I did not like later on. Well, then there are cases when I like it. Of couse still work needs to be done on those concepts, and more important, people should start using them!
/DataSets/DataSet/Units/Unit/Gathering/SiteCoordinateSets/SiteCoordinates/CoordinatesUTM
/DataSets/DataSet/Units/Unit/Gathering/SiteCoordinateSets/SiteCoordinates/CoordinatesUTM/UTMZone
/DataSets/DataSet/Units/Unit/Gathering/SiteCoordinateSets/SiteCoordinates/CoordinatesUTM/UTMEasting
/DataSets/DataSet/Units/Unit/Gathering/SiteCoordinateSets/SiteCoordinates/CoordinatesUTM/UTMNorthing
/DataSets/DataSet/Units/Unit/Gathering/SiteCoordinateSets/SiteCoordinates/CoordinatesUTM/UTMText
/DataSets/DataSet/Units/Unit/Gathering/SiteCoordinateSets/SiteCoordinates/CoordinatesGrid
/DataSets/DataSet/Units/Unit/Gathering/SiteCoordinateSets/SiteCoordinates/CoordinatesGrid/GridCellSystem
/DataSets/DataSet/Units/Unit/Gathering/SiteCoordinateSets/SiteCoordinates/CoordinatesGrid/GridCellCode
/DataSets/DataSet/Units/Unit/Gathering/SiteCoordinateSets/SiteCoordinates/CoordinatesGrid/GridQualifier


6 comments:
Hey guys - this is indeed a major problem for all biodiversity data and your suggestion of dealing with it by using metadata at the point of capture, as the responsibility of the custodian is the right approach. It then allows the users of the data and the developers of visualisation and analysis tools to filter the data according to their needs. It would be great if each data provider was capable of such extensive metadata for each record - but I think that is not the case now and for many providers may not be the case for a long time if ever. Many providers do not even have reliable values (and in many cases have nothing) in the CoordinateUncertaintyInMetres field for Darwin Core. Best practice is waht you are talking about and we should definitely be aiming for that for all new data and where providers have the resources, for a reworking of old data. We should encourage it - but we also need to look at how to make the best of the large amount of data that will never have best practice metadata. We need validation techniques that can clean data and enable robust filtering of data to enable fit for purpose data to be identified.
Be good to keep this conversation running.
BTW I like your scale dependant rendering on your development server - care to share? Ajay is just finishing off the implementation of Maxent into BioMaps. Tim I was wondering if GBIF would be interested in linking to BioMaps as a service for visualisation and analysis much as they do the beta geospatial consortium mapper?
Hi. I agree that for data provider that do not have this metadata it will be pretty complicate to ask them to do it. But my impression is that someone on the publishing chain is converting, for example, the UTM coordinates into Lat/Long. And the reason for that is Darwin Core forces to you use Lat/Lon. Or could be that GBIF only understands Lat/Long and therefore providers prefer to do the transformation. I have not seen anybody using the specified ABCD concepts (can someone help to identify one?).
So, if providers are taking the care of transforming between UTMs, or any other grid system, to Lat/Lon, I dont think it would be complicate for them to share their original data too.
Basically I see 2 areas that need further development: Darwin Core should understand more than just lat/lon and errors and GBIF should try to handle this data in their mapping solutions.
Of course then there is the need to help those people connecting providers to the network to take care of this issue.
There are other errors, like the lack of datum information on the coordinates being shared that I reckon are much more complicate, because in this case the data is unknown to the provider itself. If you dont know what datum was used to capture your coordinates then you are lost and there will be always possible errors. Maybe in this case there should me metadata specifying this situation so that the end user at least know what they are dealing with.
The scale dependant rendering map, cool name by the way!, will definetly be open as open source like always. I thought we should write a blog post about it explaining how it works behind and the problems we faced when building it. So if you are not in a hurry in little time you will see it published here.
You make some good points on how to continue to represent uncertainty in uncertain datasets. This will continue as not all studies are going to keep publishing all their GPS waypoints for every observeration.
What application are you using to generate the example maps?
Hi Dysk,
It is a simple PHP application sitting on top of mysql that generates the tile images as PNGs which can be used with the google maps libraries (I have done a Java version as well but PHP is faster due to the time it takes java to encode a PNG). Javier then did a very nice flex application using the flex google map library (?) which can be seen on the URL in the post.
Cheers
Tim
Seems there is lot of interest on this visualization. It is developed in flex using the google maps for flash API. I think that the most interesting part is the idea of using google tiles as the way to group the data. This allows fast generation of tiles overlays directly from db and that overlay perfectly.
This strategy was developed actually to create polygons on the client effectively. This is implemented on the wdpa-GBIF widget.
Ahhh tim, when are we gonna post about it?
In any case. The source code is available on request if someone wants it.
Thanks for the replies, Javier and Tim. I would definitely be interested in having a look at the source code.
Post a Comment