This is what an overview currently looks like:
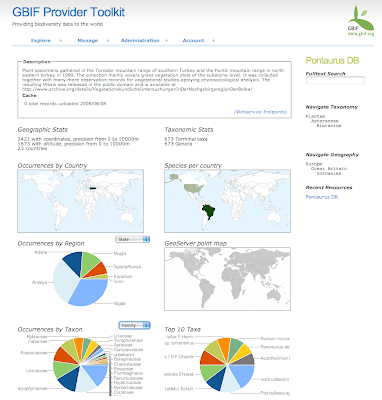
A major difference between this software and "classical" wrapper solutions in the biodiversity community, e.g. TapirLink or the BioCASE Provider Software, is to provide an extensible cache database which is specific for biodiversity datatypes. This allows to develop richer user interfaces and webservices and hopefully provide more value to end users, thereby reaching out to more data holders.
Initially the software is planned to work with occurrence/specimen data, taxonomic checklist data and general dataset descriptions using EML files. The software allows you to upload data from databases or files into the cache. Data in the cache can not be modified (other than removing/replacing the entire dataset), so during the upload the data can be analyzed and enhanced. For example UUIDs are assigned if no GUID existed already and records are compared to previously existing records, thereby detecting if a record was modified, deleted or added (information needed for incremental harvesting, e.g. via OAI). You can read more about the planned functionality on the project wiki (simple bullet points, no proper documentation I am afraid), or in subsequent posts when I will focus on different aspects of the evolving software.
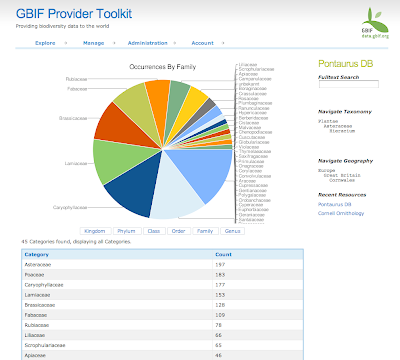
I have been using gchartjava to create the URLs for the google charts, as they can become quite unwieldy if you deal with more data. But in general it is very nice to work with the API. It is fast enough to answer dynamically generated URLs and the semi-automatic layout works pretty well. Even though this example here, number of specimens grouped by families, contains quite a lot of labels, it works well with an accompanying table.
But the best part of GCharts I think are the country maps. How many times did I want to visualise country based information? With GCharts this is dead easy. You can either assign a specific color to each ISO country (or US state within the US) or assign an integer to each country you want to mark and specify a gradient by defining the color for the max and the min value provided. So in the simplest case you can just pass the number of occurrences for each country. If that number is too large it is better to normalize it before though, because URL strings are limited in length.
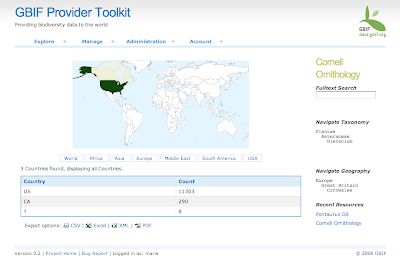
Apart from a world map, Google also provides 6 different regional focuses, for example Asia, Europe or the Middle East. So far I am impressed!


7 comments:
The screen shots seem to be linked (I get the hand icon) but nothing happens when I click on them (FF3).
Nick's right - but this is really nice to see.
It's just the way the blog software works... no live links available yet as this is under development, but both of you will be getting a demo in October. Regarding the maps, there is also the ability to do (very basic) WFS and WMS calls. The schema is basically some of the core DwC and it will return point data, since it is not designed to hnadle many millions of records...
Nick, I have a live version running here: http://db1.gbif.org:8080/providertool
But beware, it is not optimized at all and does contain dummy fake data in parts. The administration section to map & upload data needs a login, sorry.
Thats very nice Markus, But what about huge databases? Would you be able to allocate memory for them?
Are you planing to release a hosted version? I mean, if i have 200 records do i need to set up this whole thing or can i just use a gbif service?
Regarding WMS/WFS I am a little bit a exceptical as there is no GML app schema standard for it. There is no client as far as i know that can understand that this resource should be query by "scientificName" or something like this.
Nevertheless this looks great and i am looking forward for it. Release early, release often ;)
Markus:
"Nick, I have a live version running here: http://db1.gbif.org:8080/providertool"
- this is not publicly accessible as it is a dev server - only for VPN clients.
Javi:
"Regarding WMS/WFS I am a little bit a exceptical as there is no GML app schema standard for it. "
- you are correct, but... if there were 2500 installations, and all of them had the same mapping, we just need a simple 1 page document detailing how to issue the queries. It will not be automagically done by a client as you need to construct the OGC filter, but it would not be hard to document how to do it. This is an issue with any OGC installation though - right?
Maybe it's time for Javi to show us the 'lightweight server side', 'heavyweight client side' flash alternative? This could be a really good use for flex.
Hi Markus, this is looking really great. Im sure this visual breakdown of the dataset will be invaluable to the data provider.
Post a Comment