 At Ebiosphere09, there was an Informatics Challenge that Rod Page won, congratulations!
Vizzuality wanted to participate but we did not find the time to work on it. During the conference we found people like @IvyMan twittering observations on biodiversity. This was part of the "The eBiosphere Real-Time Citizen Science Challenge!" which published the rules on how to tweet.
We were far too late to participate on it, but we thought it could be cool to give it a try using the new Flex 4 "Gumbo". @xavijam from Vizzuality was starting to learn Flex 4 so he took this challenge.
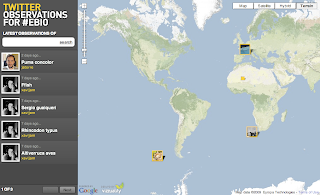
We make use of the Twitter API to query for the patterns explained on the challenge rules. Once we get the tweets, parse the latitude and longitude, get the scientific name of the observation and finally present it in a map together with images taken from Flickr.
If you want to make an observation appear on the app just tweet something like:
#eBio observation: #Puma_concolor /-50.412673039931825, -100.713207244873047/ method:iPhonePhotoFlying Puma Concolor
The idea is to mashup the data from Twitter together with the data from Flickr using the Darwin core machine tags. The reason for the second is that we are great supporters of people providing those tags and we created even some stickers to support them.
This is just an exercise to learn Flex 4 and promote the use of microformats and machine tags. But we hope you find it cool.
Some comments. Magically the tweets from @IvyMan on this disappeared while we were developing. Additionally there is not many machine tags in Flickr for the moment on darwin core terms, so there is some fakes over there too.
All the credit goes to @xavijam for working on it! And from his experiments we are learning that is not going to be that easy to migrate to Flex 4.


No comments:
Post a Comment